The Best Cities to Buy Office Property in 2025

December 3, 2024
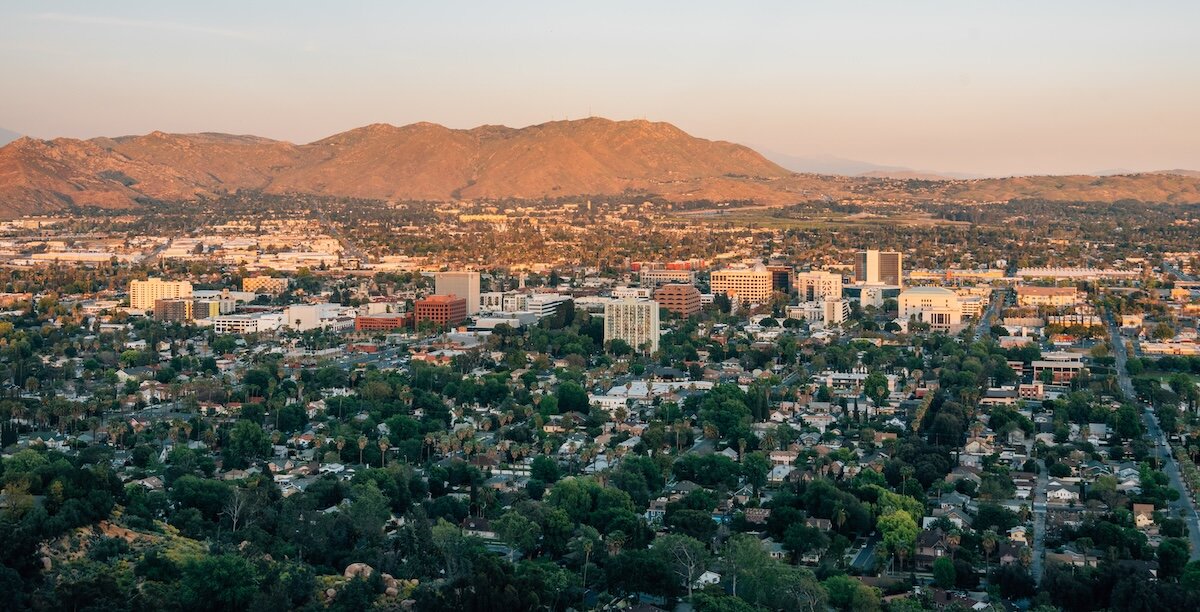
Investors in commercial real estate are constantly seeking the next profitable opportunity. Despite headwinds, office market trends indicate recovery in select regions with strong fundamentals, and plentiful corners of the office market are offering a noticeable upside, especially in a market with lower prices than the mean. To find the best investment, industry players must consider current market trends, future growth prospects of a city or region, and the potential return on investment.
The office commercial real estate market, though recently challenged, is showing early signs of recovery. Despite weak fundamentals like rising vacancy rates, stagnant demand, and sinking property values, industry experts suggest that 2025 may mark a turning point. According to the Emerging Trends in Real Estate 2025 report by the Urban Land Institute and PwC and insights from Crexi, strategic investors are beginning to view current conditions as a potential buying opportunity.
Trends in US office real estate suggest that 2025 may offer unique opportunities for strategic investors. This article spotlights ten cities with the highest potential for office CRE investment in 2025, drawing on data points such as population growth, job market strength, and rental trends.
While the office property forecast for 2025 remains cautious, improving metrics and a shifting outlook indicate that the market may be approaching its bottom. As one industry executive observed in ULI’s report, “People may look back in five years and say, ‘I wish I bought at the bottom,’ but that takes a lot of fortitude.”
If you’re looking to seize opportunities in a transitioning market, these top cities for commercial real estate offices offer compelling reasons to act now.
10 Top Cities for Office Investing in 2025
For those eyeing commercial investments in office spaces, here are ten cities you should watch in 2025. Predictions suggest these markets will see robust growth, backed by solid economic foundations, attracting local and overseas investors.
Unless stated otherwise, population data is sourced from CensusReporter.org and DataUSA.io, while commercial market stats come from the Q3 2024 U.S. Office MarketBeat report by Cushman & Wakefield. For the latest trends in each office market, we turn to Crexi Intelligence.
Let's dive deeper into each city's market forecast and investment potential.

1. Manhattan/NYC
Manhattan has had an outstanding post-pandemic recovery with premium leasing activity in Midtown, making it one of the best office markets for 2025. The area is the most densely populated and geographically smallest of New York City’s five boroughs, spans 22.7 square miles and is bordered by the Hudson River to the west, the East River to the east, and Harlem to the north. As of the latest data, it has a population of approximately 1.6 million, resulting in a density of about 70,503 people per square mile.
Over the past year, the Manhattan office market has shown signs of recovery, with businesses actively seeking office spaces in the city. The technology sector has been a significant driver of this demand. For instance, fintech startup Ramp expanded its footprint by subleasing 66,000 square feet from Microsoft at 28-40 West 23rd Street in the Flatiron District. Additionally, Bloomberg LP extended and expanded its lease at 919 Third Avenue, adding 175,841 square feet to its existing 749,035 square feet, signaling confidence in the Midtown market.
Notably, Midtown Manhattan has emerged as a leading office market post-pandemic. As of September 2024, average asking rents in Midtown reached $84 per square foot, surpassing the Manhattan-wide average of $77.86 per square foot. This resurgence is further evidenced by significant leasing activities, such as Blackstone’s lease of over 1 million square feet and Area Management’s 307,000 square feet at 245 Park Avenue.
These developments underscore the resilience and attractiveness of Manhattan’s office market, particularly in Midtown, as businesses continue to invest in and occupy premium office spaces.
Manhattan Office Market Trends
- Inventory: 539,399,084
- Vacancy rate: 17.3%
- Leasing activity:8 ,631,175
Crexi Insights
For Lease (active)
- Asking rent (annual): $49/SF
- Spaces available on Crexi: 1,718
- Median SqFt: 2,000
- Days on market: 175
For Sale (active)
- Asking sale price (median): $1.4 million
- Price/SqFt: $781
- Asking cap rate: 5.0%
- Total listings: 10
- Days on market: 223
Sales Comps (past 12 months)
- Median sales price (last 1 year): $3 million
- Sold price /SqFt: $60
- Total sales volume: $3.6 billion
- Days on market: 341
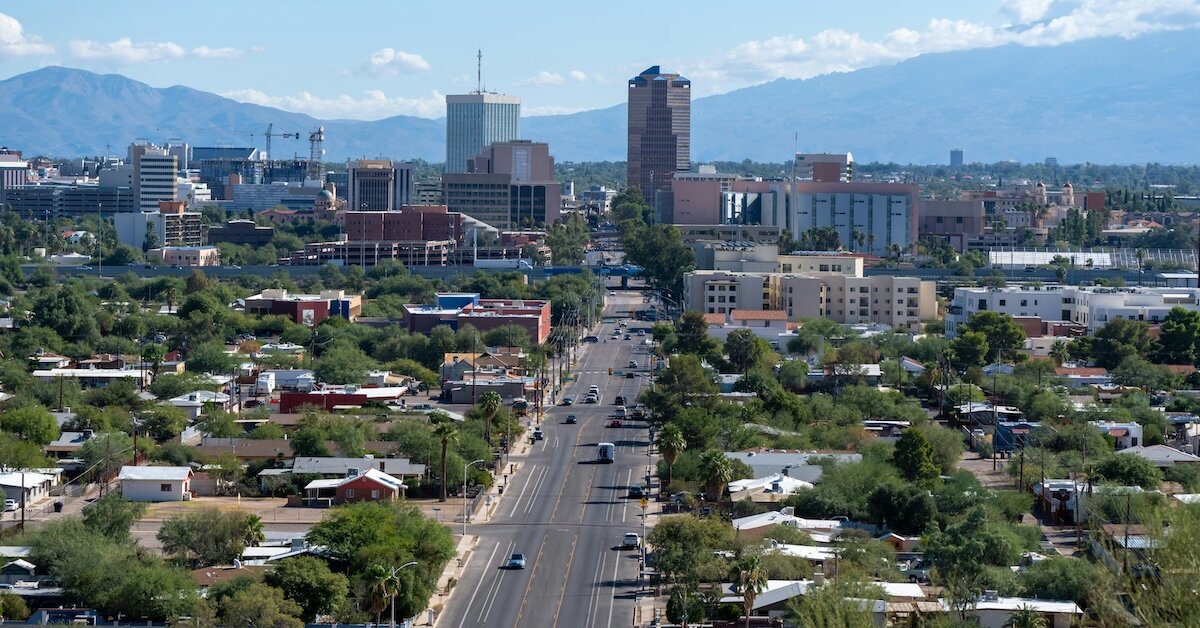
2. Tucson
Tucson, Arizona, presents a compelling opportunity as one of the top US cities for office space investment, bolstered by favorable economic indicators and a resilient real estate market. As of September 2024, the Tucson metropolitan area reported an unemployment rate of 3.8%, reflecting a stable labor market. This economic stability is further supported by a 1.2% year-over-year job growth, adding approximately 4,600 jobs, which underscores the region’s capacity for sustained economic expansion.
The office real estate sector in Tucson has demonstrated resilience compared to other regions, with a vacancy rate of 10.2% in the third quarter of 2024, indicating a balanced market. Notably, medical office spaces have seen heightened demand, driven by the expansion of healthcare services and facilities. This trend suggests a robust and growing sector within the office market, offering potential investors a stable and expanding tenant base.
Complementing these positive market dynamics, Tucson’s population growth contributes to a favorable investment environment. The city’s population is projected to reach 1.3 million by 2053, reflecting an average annual growth rate of 0.5%. This steady demographic increase supports long-term demand for office spaces, making Tucson a viable and attractive market for office property investment.
Tucson Office Market Overview
- Inventory: 28,861,931
- Vacancy rate: 10.2%
- Leasing activity: 535,411
- Under construction: 59,933
Crexi Insights
For Lease (active)
- Asking rent (annual): $19
- Median SqFt/listing: 1,922 SF
- Days on market: 296
- Total listings on Crexi: 608 spaces
For Sale (active)
- Median asking price: $962,500
- Price/SqFt: $193
- Asking cap rate: 6.5%
- Days on market: 233
- Total listings on Crexi: 121
Sales Comps (past 12 months)
- Median sold price: $395,000
- Sold price/SqFt: $180
- Total sales volume: $115.9 million
- Sold cap rate: 6.9%
- Median SqFt sold/transaction: 2,487 SF
- Days on market (median): 123
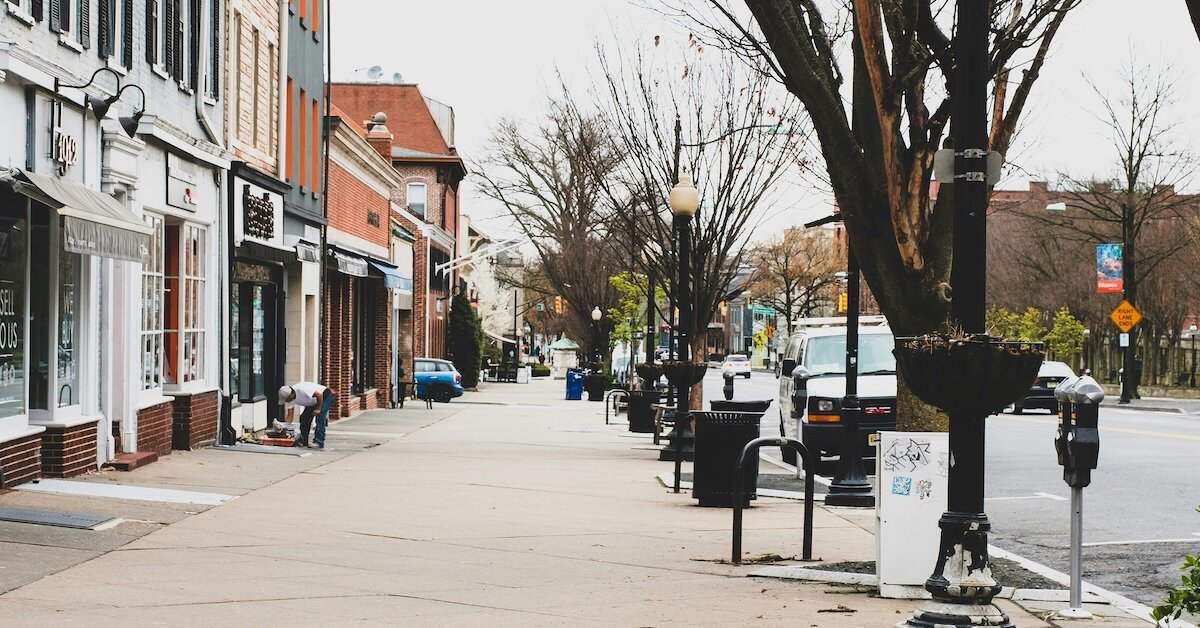
3. Central New Jersey
Central New Jersey’s prime location near major metropolitan areas, including New York City and Philadelphia, coupled with its strong transportation infrastructure, positions the market as a strong option among the best office markets for 2025. While vacancy challenges persist, the elevated rents for Class A spaces and increasing renewal activity underscore the value of targeting high-quality office properties in desirable submarkets. For investors with a long-term perspective, CNJ offers opportunities to capitalize on future economic growth and shifting office demand trends.
Central New Jersey benefits from a positive employment landscape, with jobs in the region reaching 1.6 million as of 2024. The state’s labor force participation rate increased to 68.4%, demonstrating robust workforce engagement. While the overall unemployment rate edged up slightly to 4.4%, private sector job growth has been recorded in seven of the last 12 months. CNJ has particularly benefited from these gains, reinforcing its status as a regional economic hub.
While demand for office properties remains sluggish, with no leases exceeding 100,000 square feet for two consecutive quarters, renewal activity provides a stabilizing factor. Year-to-date renewal activity increased by 3.8%, with notable transactions such as Brother International’s 82,763-square-foot renewal in Bridgewater. These renewals suggest that companies are committed to retaining a presence in the region, even as new leasing activity slows.
Central New Jersey Office Market Overview
- Inventory: 8,532,257
- Vacancy rate: 23.3%
- Leasing activity: 344,926
- Under construction: 0
Crexi Insights
For Lease (active)
- Asking rent (annual): $22
- Median SqFt/listing: 1,516 SF
- Days on market: 153
- Total listings on Crexi: 2,793 spaces
For Sale (active)
- Median asking price: $731,600
- Price/SqFt: $186
- Days on market: 169
- Total listings on Crexi: 526
Sales Comps (past 12 months)
- Median sold price: $450,000
- Sold price/SqFt: $205
- Total sales volume: $919.3 million
- Sold cap rate: 8.2%
- Median SqFt sold/transaction: 2,309 SF
- Days on market (median): 223
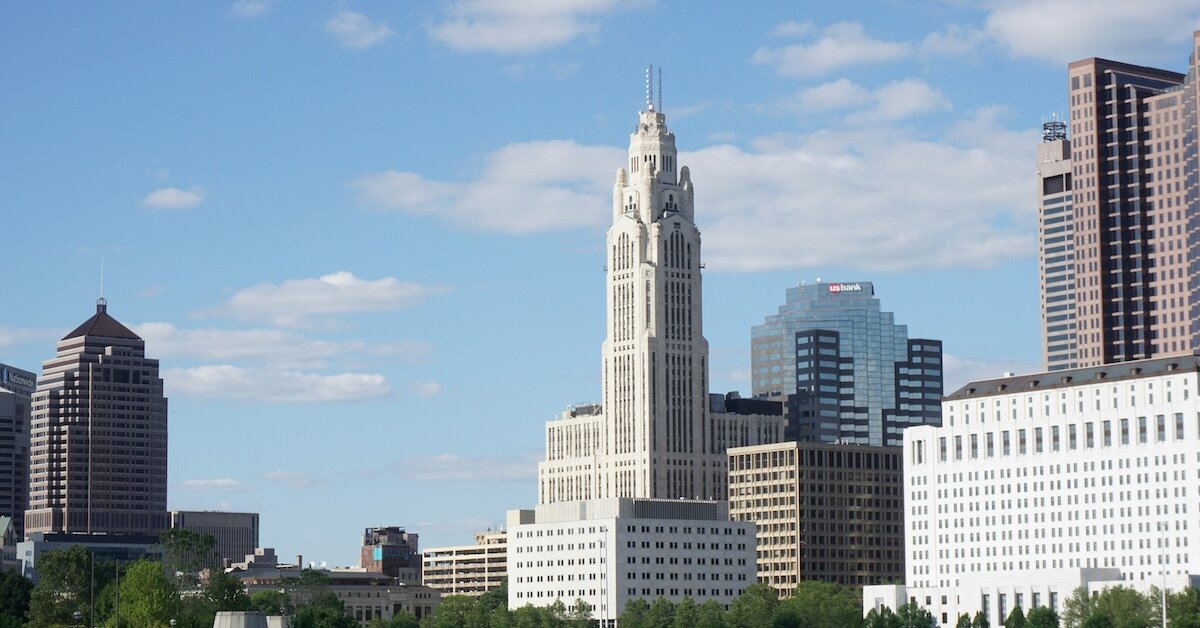
4. Columbus
Columbus, Ohio, offers a compelling environment as one of the top US cities for office space investment, characterized by a resilient economy, strategic location, and evolving market dynamics.
As of September 2024, the Columbus metropolitan area reported an unemployment rate of 3.6%, reflecting a robust labor market. The region’s diverse economic base, encompassing sectors such as education, healthcare, finance, and technology, contributes to its stability and growth potential. Notably, Columbus has experienced consistent population growth, with the city’s population reaching approximately 922,223, marking a 15% increase over the past decade. Additionally, the presence of 53 colleges and universities contributes to a steady pipeline of educated talent, further attracting businesses to the area.
The Columbus office market has demonstrated resilience amid national trends of rising vacancies. In the third quarter of 2024, the overall office vacancy rate in Greater Columbus increased to 24.7%, up from 24.0% in the previous quarter. Despite this, the market has seen positive absorption, with 124,735 square feet absorbed in the third quarter, indicating ongoing demand for office space. Average asking rents have also increased, with Class A office space commanding rates of $23.25 per square foot, reflecting the market’s strength.
The combination of a growing population, economic resilience, and strategic location positions Columbus as an attractive market for office property investment. The demand for high-quality, amenity-rich office spaces remains strong, particularly in mixed-use developments that offer “live, work, play” environments. Investors can capitalize on these trends by targeting properties that meet the evolving preferences of tenants seeking modern and flexible office solutions.
Columbus Office Market Overview
- Inventory: 35,316,206
- Vacancy rate: 24.7%
- Leasing activity: 997,370
- Under construction: 398,067
Crexi Insights
For Lease (active)
- Asking rent (annual): $16/SF
- Spaces available on Crexi: 859
- Median SqFt: 3,005
- Days on market: 381
For Sale (active)
- Asking sale price (median): $1 million
- Price/SqFt: $168
- Asking cap rate: 7.7%
- Total listings: 10
- Days on market: 96
Sales Comps (past 12 months)
- Median sold price: $675,000
- Sold price /SqFt: $84
- Sold cap rate: 9.6%
- Total sales volume: $131.9 million
- Days on market: 166
5. Colorado Springs
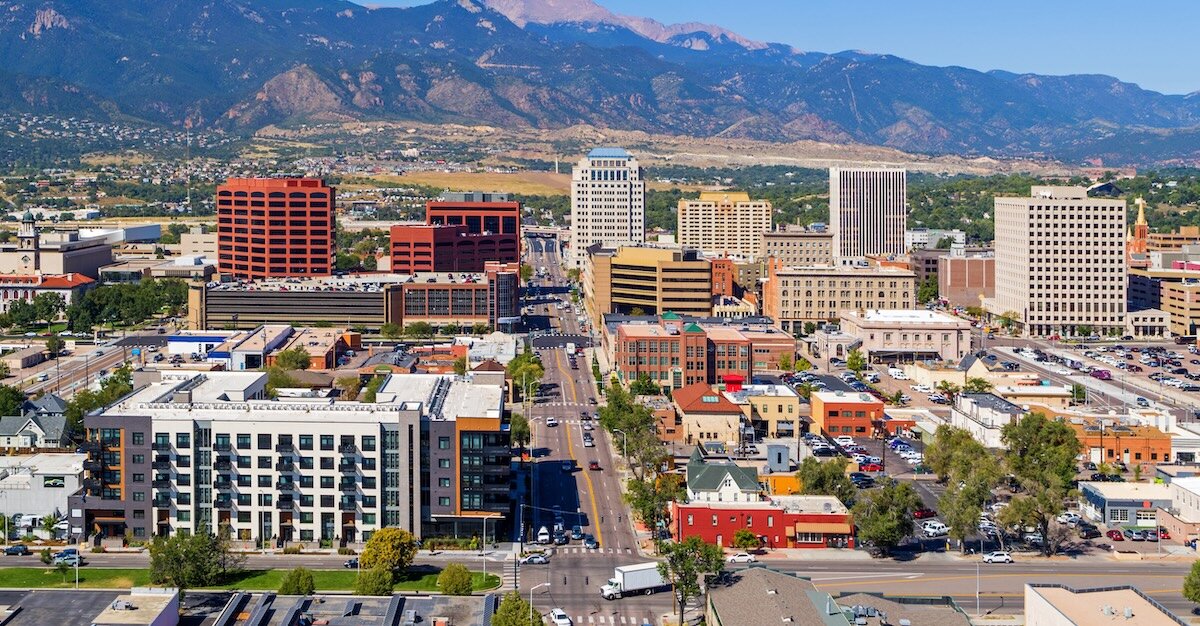
Colorado Springs ranks on our list of emerging office markets to watch in 2025 thanks to its strong absorption and decreasing vacancy. As of the third quarter of 2024, the Colorado Springs office market exhibited positive absorption trends, with a trailing 12-month net absorption of 200,000 square feet, indicating a rebound in demand. The vacancy rate decreased by 0.5 percentage points over the past year, settling at 10.4%, which remains below the national average of 13.9%. Notably, there are no significant office construction projects underway, mitigating near-term supply-side risks and supporting market stability.
The local economy demonstrates robust health, with the Colorado Springs metropolitan area reporting an unemployment rate of 3.7% as of September 2024, reflecting a strong labor market. The region’s diverse economic base, including sectors such as aerospace, defense, and technology, contributes to its stability and growth potential. Colorado Springs’ affordability and growth is attracting investors priced out of larger gateway markets. The city’s highly skilled workforce and quality of life further enhance its attractiveness for businesses and investors alike.
Colorado Springs Office Market Overview
- Inventory: 7,765,200
- Vacancy rate: 10.4%
Crexi Insights
For Lease (active)
- Asking rate/SqFt (median): $17 per year
- Median SqFt/listing: 1,955 SF
- Days on market: 218
- Total listings on Crexi: 770 spaces
For Sale (active)
- Median asking price: $1.5 million
- Price/SqFt: $172
- Asking cap rate: 7.6%
- Days on market: 174
- Total listings on Crexi: 92
Sales Comps (past 12 months)
- Median sold price: $868,800
- Sold price/SqFt: $195
- Total sales volume: $35.5 million
- Median SqFt sold/transaction: 4,863 SF
- Days on market (median): 284

6. Inland Empire
The Inland Empire, encompassing Riverside and San Bernardino counties in California, presents a compelling opportunity for office property investment, driven by favorable market dynamics and economic growth.
As of the third quarter of 2024, the Inland Empire’s office market reported an overall vacancy rate of 9.1%, a slight increase of 10 basis points from the previous quarter and 30 basis points year-over-year. Despite this uptick, the region maintains one of the lowest vacancy rates among major Southern California markets, indicating a stable demand for office space. The average asking rent stood at $2.23 per square foot per month on a full-service basis, reflecting a 0.8% decrease both quarterly and annually, suggesting competitive pricing that’s advantageous for investors.
Between August 2023 and August 2024, the Inland Empire added 33,600 nonfarm jobs, marking a 2.0% year-over-year growth. The private education and health services sectors led this expansion, contributing 18,300 jobs, a 6.3% increase, driven by rising demand due to population growth. Government employment also grew, adding 11,700 jobs, a 4.7% increase, reflecting ongoing public sector investment.
Inland Empire Office Market Overview
- Inventory: 21,224,636
- Vacancy rate: 9.1%
- Leasing activity: 918,330
- Under construction: 0
Crexi Insights
For Lease (active)
- Asking rate/SqFt (median): $24 per year
- Median SqFt/listing: 2,002 SF
- Days on market: 175
- Total listings on Crexi: 595 spaces
For Sale (active)
- Median asking price: $1.8 million
- Price/SqFt: $239
- Asking cap rate: 6.4%
- Days on market: 247
- Total listings on Crexi: 84
Sales Comps (past 12 months)
- Median sold price: $662,500
- Sold price/SqFt: $224
- Sold cap rate: 6.4%
- Total sales volume: $230.8 million
- Median SqFt sold/transaction: 3,284 SF
- Days on market (median): 244
7. Raleigh/Durham
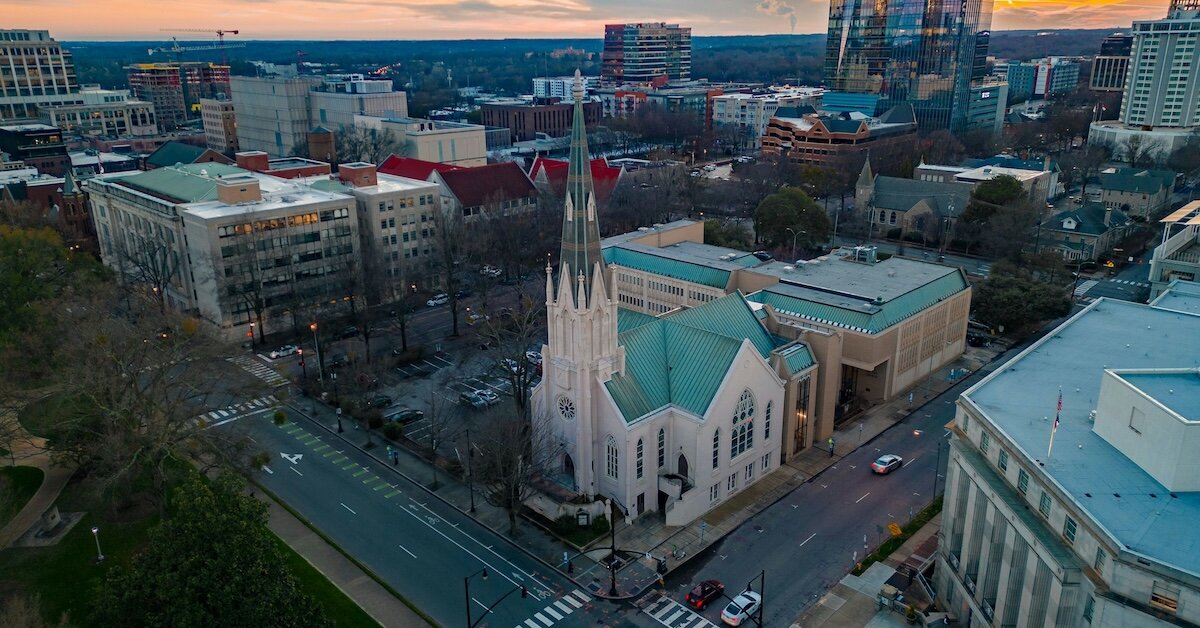
The Raleigh-Durham area, integral to the Research Triangle region, continues to experience significant population and economic growth. Wake County, encompassing Raleigh, has seen its population increase by approximately 62 people per day, adding 225,000 residents over the past decade. This growth fuels demand for office space, particularly within the thriving tech sector. Between 2018 and 2023, Raleigh-Durham’s tech talent workforce expanded by 17.9%, adding 11,390 professionals, marking the sixth-largest job growth rate among major U.S. tech markets.
The region’s diverse economy, bolstered by strong educational and healthcare sectors, underpins its office market. In the third quarter of 2024, new leasing activity remained robust, with over 567,000 square feet of deals signed, including notable transactions such as Parexel International’s 61,000-square-foot lease at Tower 5 in North Hills. Despite a slight increase in the overall vacancy rate to 24.4%, which makes it among the cities with the highest office vacancy rates on our list, the average asking rent rose to $31.28 per square foot, a 6.0% year-over-year increase, indicating sustained demand for quality office spaces.
These factors highlight Raleigh-Durham’s resilience and attractiveness as a market for office investment, driven by a growing population, a flourishing tech industry, and a stable economic foundation.
Raleigh/Durham Office Market Overview
- Inventory: 57,862,575
- Vacancy rate: 24.4%
- Leasing activity: 1,829,633
- Under construction: 35,350
Crexi Insights - Raleigh
For Lease (active)
- Asking rate/SqFt (median): $27 per year
- Median SqFt/listing: 1,991 SF
- Days on market: 139
- Total listings on Crexi: 445 spaces
For Sale (active)
- Median asking price: $1.7 million
- Price/SqFt: $344
- Days on market: 89
- Total listings on Crexi: 35
Sales Comps (past 12 months)
- Median sold price: $1.2 million
- Sold price/SqFt: $300
- Total sales volume: $196.6million
- Sold cap rate: 6.3%
- Median SqFt sold/transaction 2,437 SF
- Days on market (median): 98
Crexi Insights - Durham
For Lease (active)
- Asking rate/SqFt (median): $24 per year
- Median SqFt/listing: 2,404 SF
- Days on market: 138
- Total listings on Crexi: 232 spaces
For Sale (active)
- Median asking price: $1.8 million
- Price/SqFt: $256
- Asking cap rate: 6%
- Days on market: 161
- Total listings on Crexi: 23
Sales Comps (past 12 months)
- Median sold price: $760,000
- Sold price/SqFt: $236
- Total sales volume: $11.2 million
- Sold cap rate: 6.6%
- Median SqFt sold/transaction 3,328 SF
- Days on market (median): 132
8. Tacoma
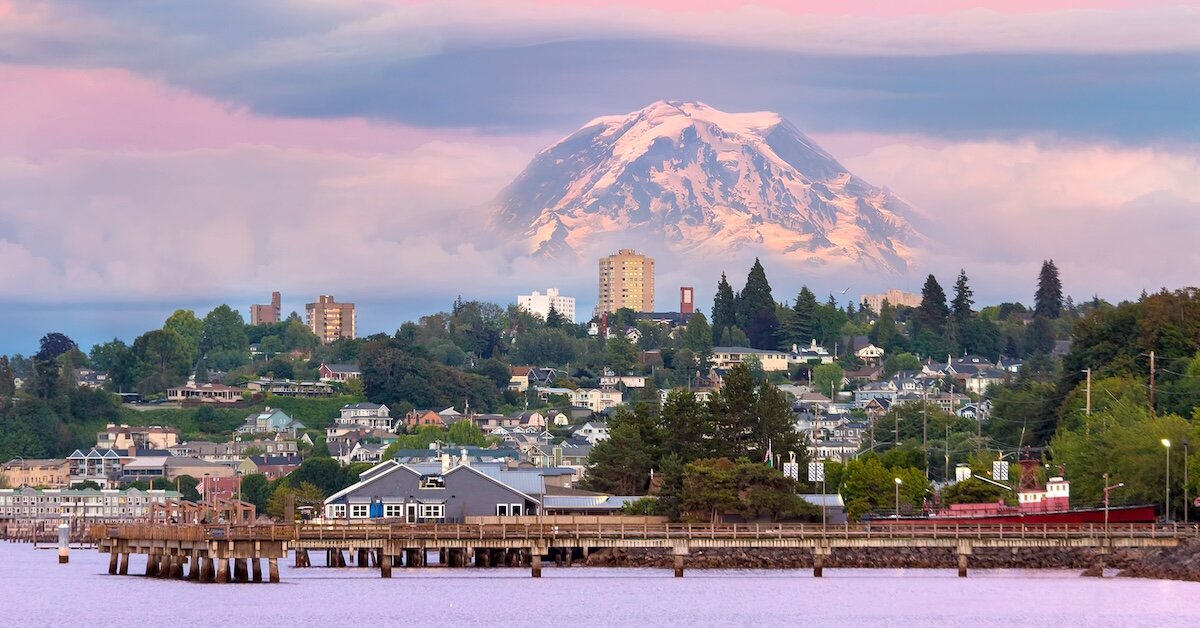
Tacoma, Washington, presents a compelling opportunity for office property investment, driven by favorable economic indicators and competitive real estate pricing. As of September 2024, the Tacoma metropolitan division reported an unemployment rate of 4.2%, reflecting a stable labor market. The city’s population stands at approximately 222,932, with a median household income of $89,107, indicating a robust economic environment.
In the commercial real estate sector, Tacoma’s office space market offers attractive investment prospects. In 2023, the average sale price for office space was $178.74 per square foot, which is 28.4% lower than the Washington state average of $249.72 per square foot, providing cost-effective opportunities for investors. Additionally, the city’s strategic location within the Puget Sound region enhances its appeal, offering access to a diverse and growing economic base.
Tacoma/Seattle Suburbs Office Market Overview
- Inventory: 7,676,952
- Vacancy rate: 23.0%
- Deliveries: 156,367
- Under construction: 0
Crexi Insights
For Lease (active)
- Asking rate/SqFt (median): $26 per year
- Median SqFt/listing: 2,675 SF
- Days on market: 96
- Total listings on Crexi: 195 spaces
For Sale (active)
- Median asking price: $2 million
- Price/SqFt: $186
- Asking cap rate: 6.6%
- Days on market: 170
- Total listings on Crexi: 34
Sales Comps (past 12 months)
- Median sold price: $1 million
- Sold price/SqFt: $238
- Total sales volume: $5.8 million
- Median SqFt sold/transaction: 3,200SF

9. Boise
Boise, Idaho, has demonstrated notable economic and demographic growth, making it an emerging office market to watch in 2025. Since last measurement, the city’s population increased by 1.15%, from 231,537 to 234,192 residents. During the same period, the median household income rose by 11.7%, reaching $76,402. This upward trajectory reflects a robust local economy and an expanding workforce, enhancing the demand for office spaces.
In our office market overview, Boise remains resilient, with a vacancy rate of 10.2% as of the third quarter of 2024, slightly below the national average. The average direct asking rent increased to $24.01 per square foot per year, indicating sustained demand for quality office spaces. The city’s high quality of life, low cost of doing business, and well-educated workforce continue to attract both local and coastal companies, further fueling demand for office space. With limited new construction, the expansion of diverse industries suggests a positive future for Boise’s office market.
Boise Office Market Overview
- Inventory: 17,252,177
- Vacancy rate: 10.2%
- Leasing activity: 734,793
- Deliveries: 120,000
Crexi Insights
For Lease (active)
- Asking rate/SqFt (median): $19 per year
- Median SqFt/listing: 2,346 SF
- Days on market: 239
- Total listings on Crexi: 443 spaces
For Sale (active)
- Median asking price: $1.1 million
- Price/SqFt: $280
- Asking cap rate: 6.2%
- Days on market: 111
- Total listings on Crexi: 45
Sales Comps (past 12 months)
- Median sold price: $997,500
- Sold price/SqFt: $220
- Total sales volume: $56.2 million
- Median SqFt sold/transaction: 4,217 SF
- Days on market (median): 125

10. Knoxville
Knoxville, Tennessee, presents a compelling opportunity for office property investment, supported by robust economic indicators and favorable market dynamics. As of October 2024, the Knoxville metropolitan statistical area reported an unemployment rate of 3.3%, reflecting a strong labor market. The region’s real gross domestic product (GDP) expanded by 3.5% in 2023, surpassing the national average and indicating a resilient economy. Additionally, Knoxville has emerged as a popular destination for homebuyers, ranking second on Realtor.com’s list of most popular housing markets in 2024, attracting interest from both regional and national investors.
The commercial real estate market in Knoxville has demonstrated resilience and growth. In 2023, the total office sales volume reached $100.6 million across nine transactions, with the largest sale being 9721 Sherrill Blvd, which sold for $35 million in March 2023. Additionally, 47,346 square feet of new office space were delivered in 2023, indicating ongoing development and investor confidence in the market. These factors, combined with Knoxville’s strategic location and economic stability, make it an attractive market for office property investment.
Knoxville Office Market Overview
- Inventory: 37,500,000
- Vacancy rate: 3.2%
Crexi Insights
For Lease (active)
- Asking rate/SqFt (median): $20 per year
- Median SqFt/listing: 2,537 SF
- Days on market: 148
- Total listings on Crexi: 220 spaces
For Sale (active)
- Median asking price: $1.2 million
- Price/SqFt: $182
- Asking cap rate: 6.5%
- Days on market: 181
- Total listings on Crexi: 35
Sales Comps (past 12 months)
- Median sold price: $500,000
- Sold price/SqFt: $156
- Total sales volume: $139 million
- Sold cap rate: 7.8%
- Median SqFt sold/transaction: 3,228 SF
- Days on market (median): 156


