Crexi National Commercial Real Estate Report: April 2025


Welcome to the April 2025 release of our Crexi Trends report. We analyze Crexi's database each month to identify relevant activity and patterns and share key insights with our users.
Our report showcases trends across Crexi's commercial property listings in April, evaluating average price per square foot, search behavior, occupancy, and other noteworthy metrics. With this information, we aim to arm commercial real estate professionals with actionable learnings to make well-informed commercial real estate decisions.
Retail
For Sale
Pricing: In April 2025, the median sold price for retail properties listed on Crexi rose to $202.56 per square foot, marking a 9.24% increase compared to the previous year. This continued price growth reflects strong demand from buyers seeking stable cash flow from tenant-occupied centers, particularly in suburban locations. The growth occurred alongside a slight dip in asking prices per square foot for retail, which (while still higher) hit $254.62, down 8.98% from its July 2024 peak of $279.75.
Cap Rates: Retail assets recorded a median sale cap rate of 6.68%, slightly decreasing to reach closer lockstep with its asking cap rates, which stood at 6.54%. This tightening spread indicates sustained investor demand, with buyers still accepting tighter yields on well-performing properties amid constrained new supply.
For Lease
Asking vs. Effective Lease Rates: The median annual asking lease rate for retail spaces in April was $19.05 per square foot (up 3.71% YoY), while the effective lease rate fell to a $17.91 average per square foot. Interestingly, landlords are proving willing to negotiate lower rents for more advantageous lease terms (longer leases, TA allowances) to lock in lower vacancy and more secure NOI. The limited availability of retail leasing space may also provide a buffer against potential deal delays due to rising consumer costs and continued market fluctuations.
Absorption: Retail properties experienced an absorption rate of 1.35% in April, a noticeable increase from March, suggesting improved leasing momentum. This trend reflects a heightened interest from tenants in locking down good terms in good real estate, especially among service-based businesses, as supply constraints continue to drive upward rent growth.
Broader Trends
The retail sector is grappling with significant changes following the announcement of President Trump’s sweeping tariffs in April 2025. These tariffs, including a 145% levy on Chinese imports and the closure of the de minimis exemption for low-value shipments, have disrupted supply chains and increased costs for retailers. Major retailers like Target have acknowledged the inevitability of price increases due to these tariffs, despite efforts to mitigate the impact by diversifying supply chains and sourcing from alternative countries.
These developments have led to a cautious approach in retail real estate investment. Early signs of strain are emerging in the retail sector, with some deals being paused as stakeholders assess the long-term implications of the tariffs. The uncertainty surrounding trade policies is causing retailers to reconsider expansion plans, particularly in malls and lifestyle centers that house a high number of apparel tenants .
While some emerging retail brands see opportunities to gain market share as larger competitors struggle with increased costs, the overall sentiment in the retail real estate market remains cautious as stakeholders navigate the evolving economic landscape.
Office
For Sale
Pricing: Office assets traded at a median sale price of $169.10 per square foot in April, up 11.9% year-over-year. This marks a continuation of the impressive pricing rebound observed in Q1, particularly in Class A inventory located in urban cores and mixed-use developments.
Cap Rates: The median sale cap rate for office properties was 7.25%, while asking cap rates were lower at 7.02%. The higher sale cap rate suggests some investor hesitancy and the persistence of pricing gaps between buyer and seller expectations.
For Lease
Asking vs. Effective Lease Rates: Average asking lease rates were $19.97 per square foot, compared to $18.37 effective, reflecting moderate concessions and allowances in tenant negotiations. The nearly $1.60 gap between rates indicates that landlords are still working to maintain occupancy levels in a mixed-demand environment.
Broader Trends
While national office vacancy remains elevated, Crexi data suggests incremental improvements in pricing and absorption. The 1.11% absorption rate recorded in April reflects modest progress in backfilling space as employers enforce their return-to-office plans. Smaller footprints and flight-to-quality trends remain dominant, with tenants willing to pay a premium for highly amenitized and transit-accessible spaces.
Office leasing activity is up in markets like Miami and Dallas, where hybrid workforces are stabilizing and office-to-residential conversions are reducing available inventory. However, secondary and tertiary markets continue to lag in leasing recovery. As interest rates begin to plateau, opportunistic buyers are re-entering the market targeting distressed or repositionable assets.
Industrial
For Sale
Pricing: The median sale price for industrial properties on Crexi reached $106.85 per square foot in April 2025, up 12.8% year-over-year. While price growth remains strong, the pace has cooled slightly compared to 2023, suggesting a normalization in investor expectations and hesitance to transact amid economic uncertainty related to manufacturing and imports.
Cap Rates: Industrial sale cap rates averaged 7.25%, with asking cap rates keeping pace at an average of 7.20%. The close spread reflects equilibrium in buyer and seller sentiment, with pricing holding steady in core logistics and light manufacturing locations balanced by high demand and uncertain market conditions.
For Lease
Asking vs. Effective Lease Rates: The median asking lease rate for industrial properties held steady $13.99 per square foot (up 3.25% YoY), while the effective rate was $12.68. The gap between asking and effective rates reflects the increased use of concessions such as free rent and tenant improvement allowances, particularly in markets with a recent influx of new supply. Landlords are adjusting deal structures to compete for tenants in areas where speculative developments have pushed vacancy higher or where tenants have more options.
Absorption: Reflecting this transaction slowdown, industrial absorption fell to 1.21% in April, slightly down from the prior month, buoyed by continued demand for last-mile and cold storage space. Tenants are gravitating toward infill markets where access to transportation infrastructure remains critical.
Broader Trends
The industrial market remains healthy but is undergoing a shift as higher construction costs (especially impacted by material imports) and financing constraints temper speculative development. New deliveries have slowed, creating tighter conditions in some infill markets. As a result, tenants seeking space in land-constrained metros are facing higher rents and more competition for move-in ready space.
At the same time, tariffs and global trade shifts are prompting companies to reassess their logistics strategies. The trend toward onshoring is accelerating, with a growing number of manufacturers exploring secondary industrial markets that offer cost advantages and proximity to population centers. These shifts are expected to fuel additional leasing activity throughout the year.
Multifamily
For Sale
Pricing: Multifamily properties posted a median sale price of $188.71 per square foot in April, representing a 5.9% year-over-year decline. Despite softening pricing, investor appetite remains strong for well-located assets, particularly those with value-add potential in growing secondary markets.
Cap Rates: The median sale cap rate for multifamily assets dropped from its March 2025 peak to 6.44% in April, while asking cap rates continued their 12-month growth streak to hit 7.12%. This widening spread indicates ongoing price discovery in the market, as buyers adjust to new financing realities and underwriting thresholds.
Absorption: Multifamily absorption reached 1.47% on Crexi in April, the highest across all major property types. Demand continues to be driven by population growth, delayed homeownership, and a growing renter preference among younger households.
Broader Trends
Multifamily fundamentals remain bifurcated depending on market and asset class. On one hand, Class A properties in high-growth metros are facing increased competition due to a wave of new deliveries. Markets like Austin, Atlanta, and Nashville have seen elevated vacancy rates as thousands of new units come online, leading to flat or negative rent growth in the short term. As the supply wave peaks, effective rents declined year-over-year in more than a dozen major U.S. cities as of April, with concessions becoming more common for lease-ups and newer product. However, leasing activity remains stable in established, infill submarkets where demand remains consistent.
On the other hand, Class B and workforce housing continue to attract investor interest due to their relative affordability and resilient occupancy. The homeownership affordability gap is widening as mortgage rates remain elevated and housing supply remains constrained, keeping more renters in place and supporting long-term demand for multifamily. Institutional and private capital alike are shifting strategies to pursue middle-market assets in Midwest and Southeastern markets that offer better yield profiles. While price discovery is still ongoing, especially for assets acquired at peak valuations, overall investor sentiment remains constructive heading into the second half of 2025.
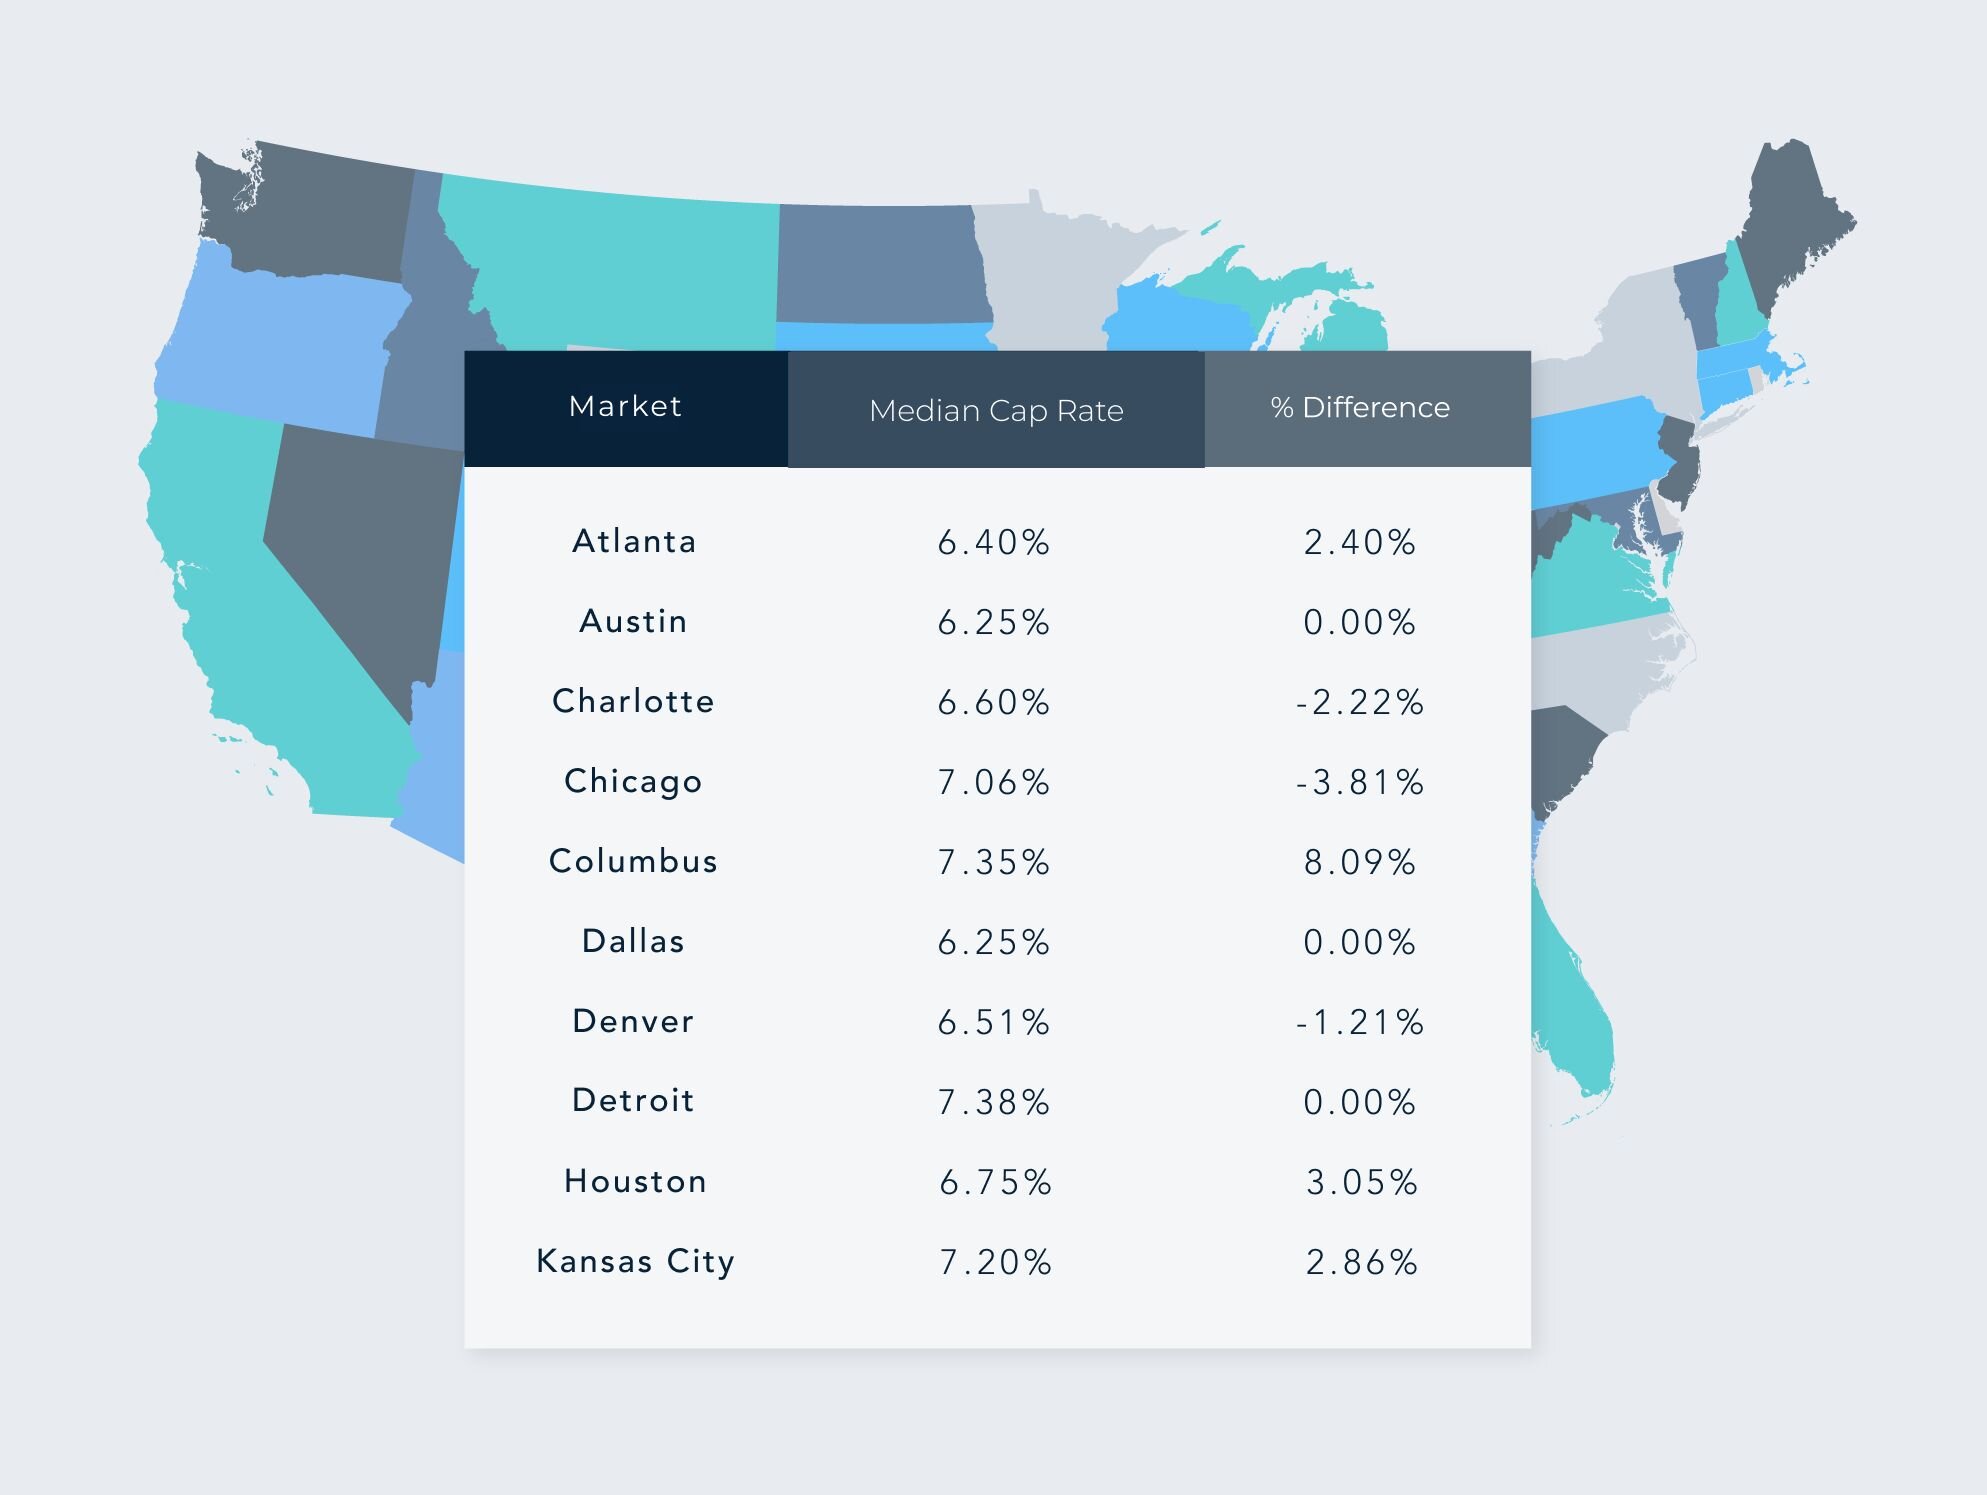
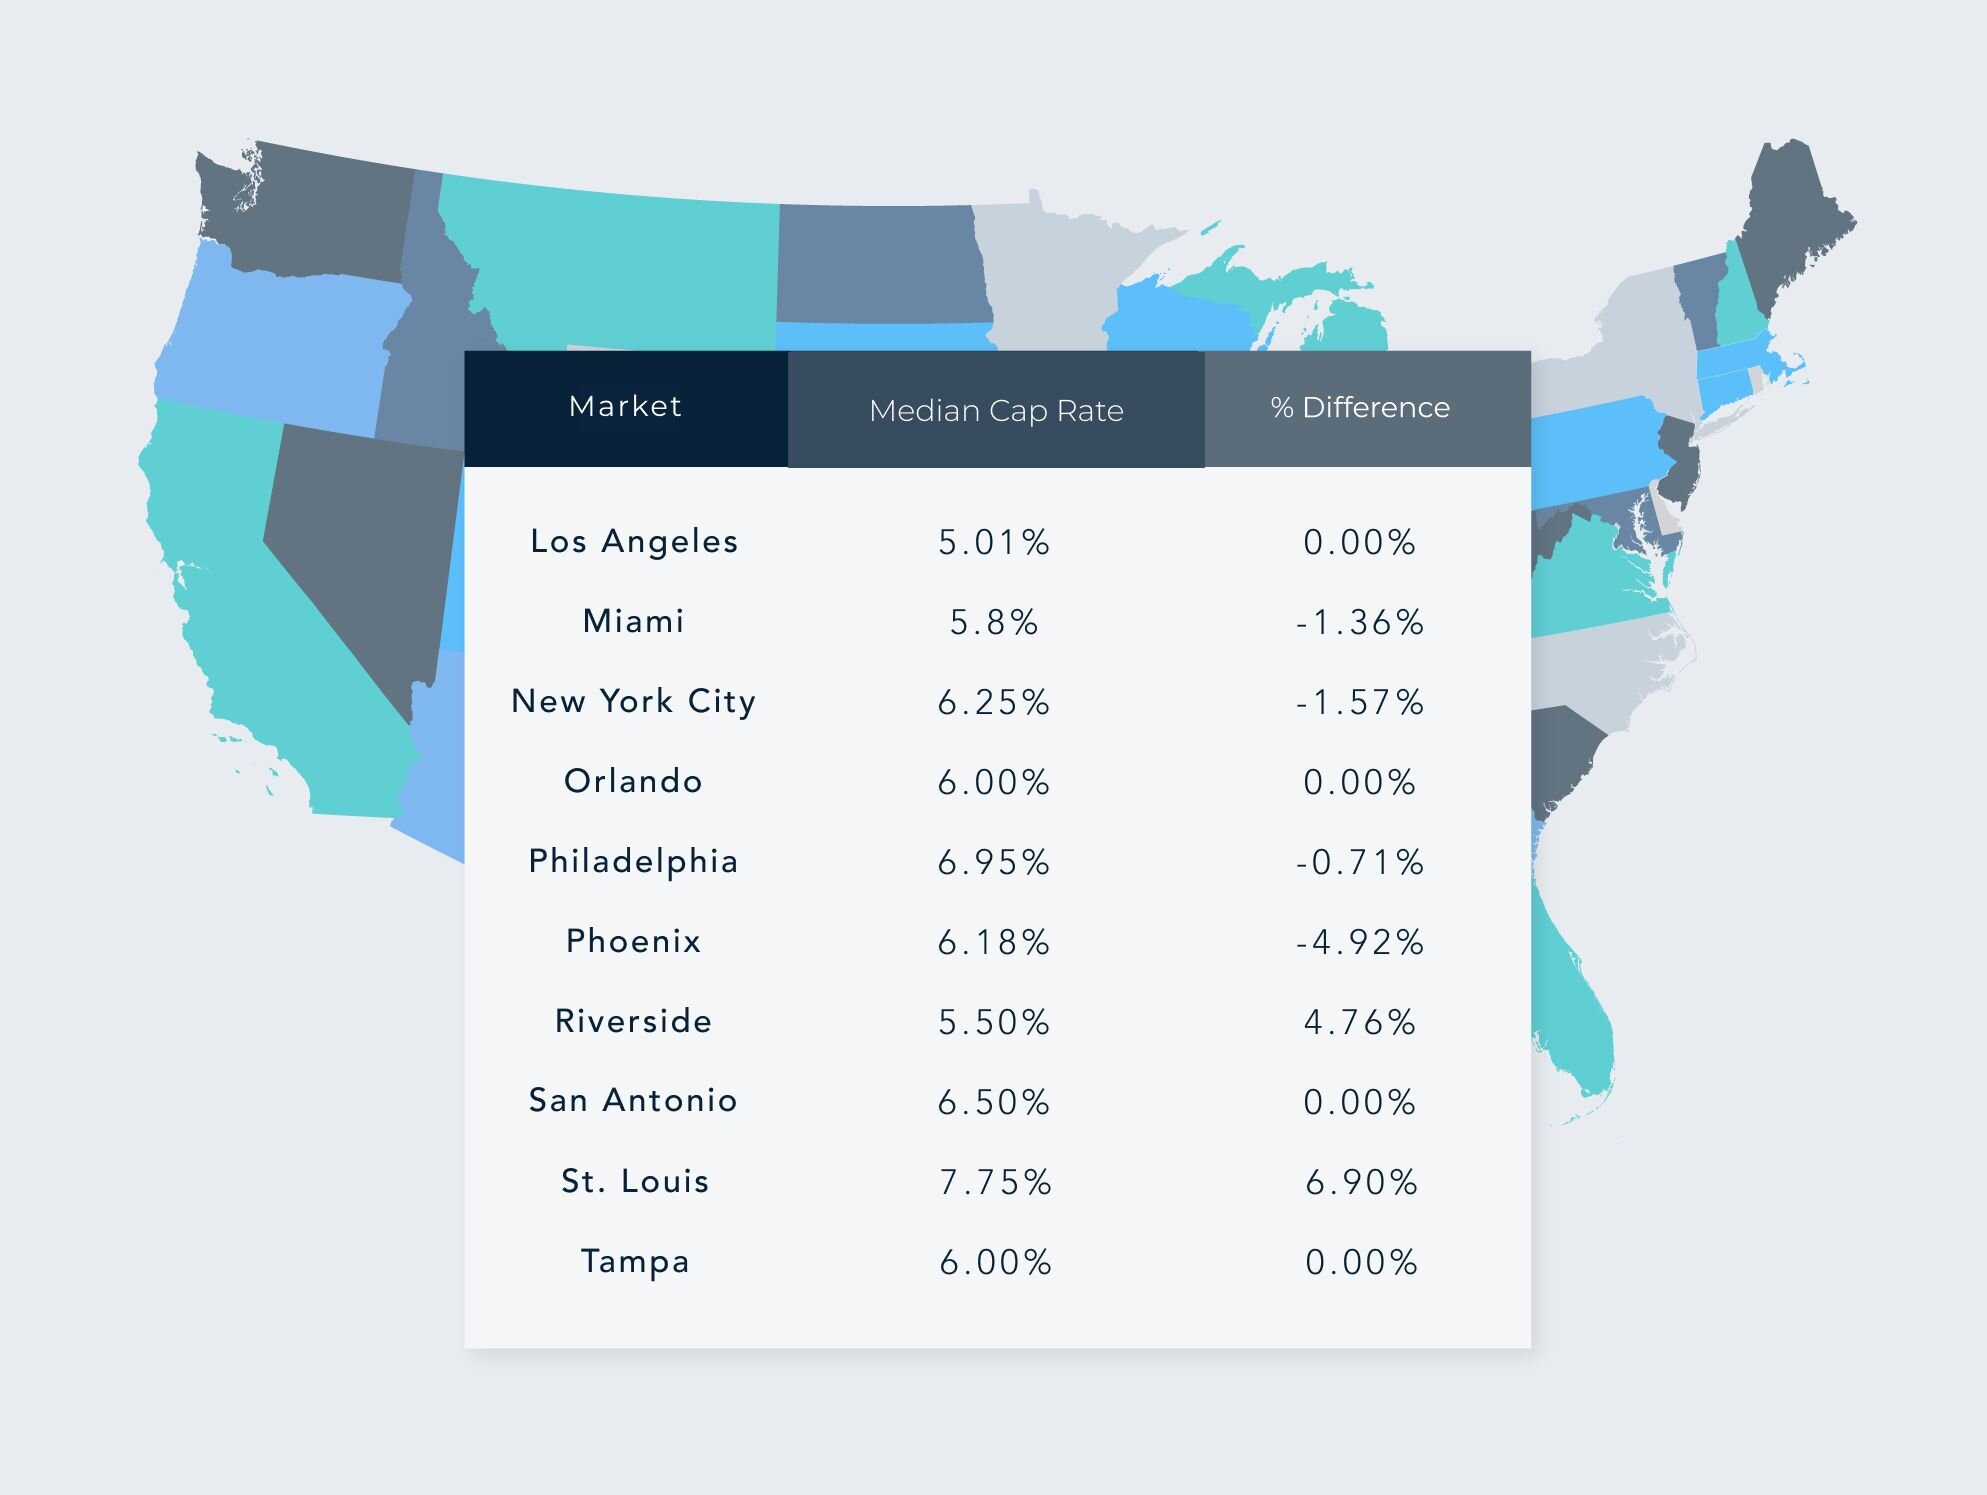
Regional Breakdown: Median Cap Rates & Changes by Top MSAs – April 2025


Disclaimer: This article's information is based on Crexi's internal marketplace data and additional external sources. While asking price in many ways reflects market conditions, variations in pricing are affected by changes in inventory, asset size, etc. Nothing contained on this website is intended to be construed as investing advice. Any reference to an investment's past or potential performance should not be construed as a recommendation or guarantee towards a specific outcome.
Get more data-driven insights with Crexi Intelligence.


