Crexi National Commercial Real Estate Report: August 2025


Welcome to the August 2025 release of our Crexi Trends report. We analyze Crexi's database each month to identify relevant activity and patterns and share key insights with our users.
This national commercial real estate market update, based on Crexi Intelligence data and commercial property listings, highlights key CRE pricing, leasing, and investment trends from August 2025. With this information, we aim to arm commercial real estate professionals with actionable learnings to make well-informed CRE decisions.
Key Takeaways
- Retail is resilient but tariff-sensitive: Sold pricing rose 6.90% YoY with faster deal velocity (days on market decreased 6.92% YoY). Grocery-anchored and discount formats remain strong, though tariffs are reshaping inventory and leasing strategies.
- Office is slowest to transact: Pricing is up 9.64% YoY, but listings linger an average 239 days on market (+19.50% YoY). Despite positive headlines, buyers demand higher yields, and sellers must prepare for longer marketing cycles.
- Industrial shows cooling momentum: Sold pricing fell 1.94% MoM but remains 8.4% higher YoY. DOM increased to 240 days, reflecting selective underwriting and cautious investor sentiment in secondary markets.
- Multifamily remains relatively stable: Pricing advanced 1.20% YoY with DOM at 152 days, faster than office or industrial. Strong competition persists for stabilized, well-located communities.
- Macro conditions shape all sectors: The Fed’s July rate hold and talk of potential cuts later in 2025, coupled with ongoing tariff uncertainty, continue to weigh on transaction timelines and pricing expectations.
Retail
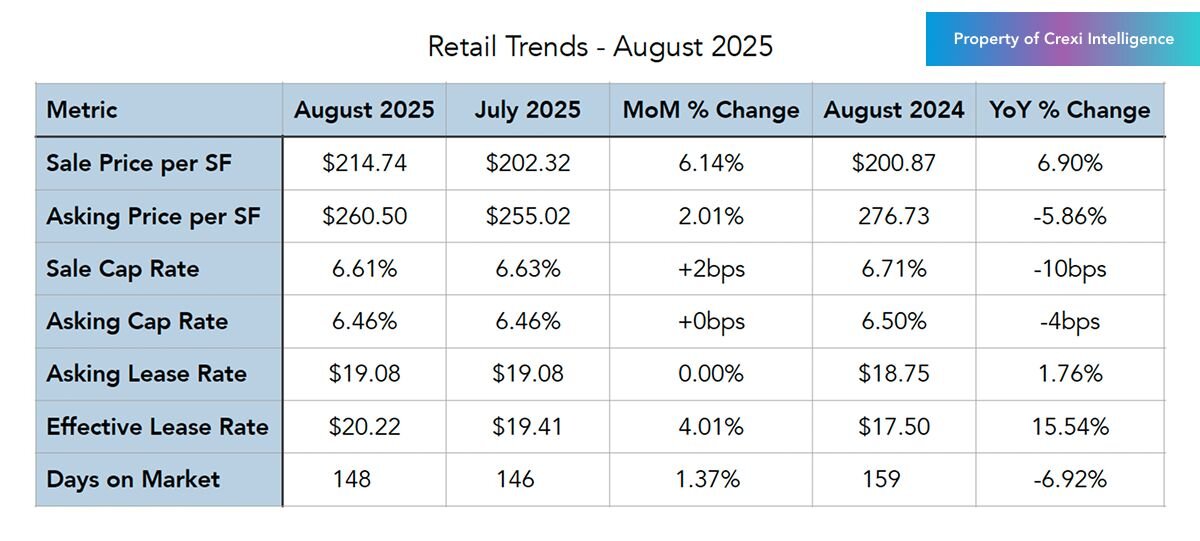
For Sale
Pricing: August’s median sale price reached $214.74/SF, up 6.14% MoM and 6.90% YoY. The month‑over‑month gain in sold pricing follows a softer July, suggesting that buyers are stepping in for stabilized, necessity assets such as anchored or experiential strip centers. This growth coincides with modest pullback in asking prices that narrowed bid‑ask spreads, allowing more trades to clear in the mid-Q3 pipeline.
Cap Rates: Sale caps printed 6.61% (‑0.19% MoM, ‑1.49% YoY) while asking caps held at 6.46% (0.00% MoM, ‑0.62% YoY). The flat asking yield alongside slightly lower closed yields points to competitive bidding on best‑located assets, even as underwriting remains conservative.
Days on Market: Retail properties averaged 148 days on market in August, a slight 1.37% increase MoM but 6.92% faster YoY. The year-over-year improvement suggests healthier deal velocity compared to 2024, though the small monthly uptick signals typical seasonal slowdown as investors take longer to close during summer months.
For Lease
Asking vs. Effective Lease Rates: Asking rents held at $19.08/SF/yr, while effective rents jumped to $20.22/SF/yr (+4.19% MoM, +15.54% YoY). This signals that while landlords might be pulling back on concessions for some locations, the deals that are getting done are commanding higher market rents.
The Big Picture
Retail sales continued to firm, with July retail and food services up 0.5% MoM and 3.9% YoY, a signal that consumer outlays remain supportive of tenant revenues. In addition to the demand backdrop, policy remains a swing factor. The FOMC held the policy rate at the July 30 meeting and noted moderating activity, which affects capital costs and deal underwriting.
Furthermore, it’s worth noting that experts expect 2025 U.S. import volumes to end about 5.6% below 2024 as tariffs bite, prompting retailers to trim or re-time orders as they reconfigure their supply chains. Supply chain briefs also flagged some front-loading during tariff pauses, which temporarily influenced seasonal inventory and supported short-term space needs. If rate cuts begin later this year, as some Fed officials have suggested publicly, debt costs could gradually improve into 2026, which would help price discovery for retail assets.
Office
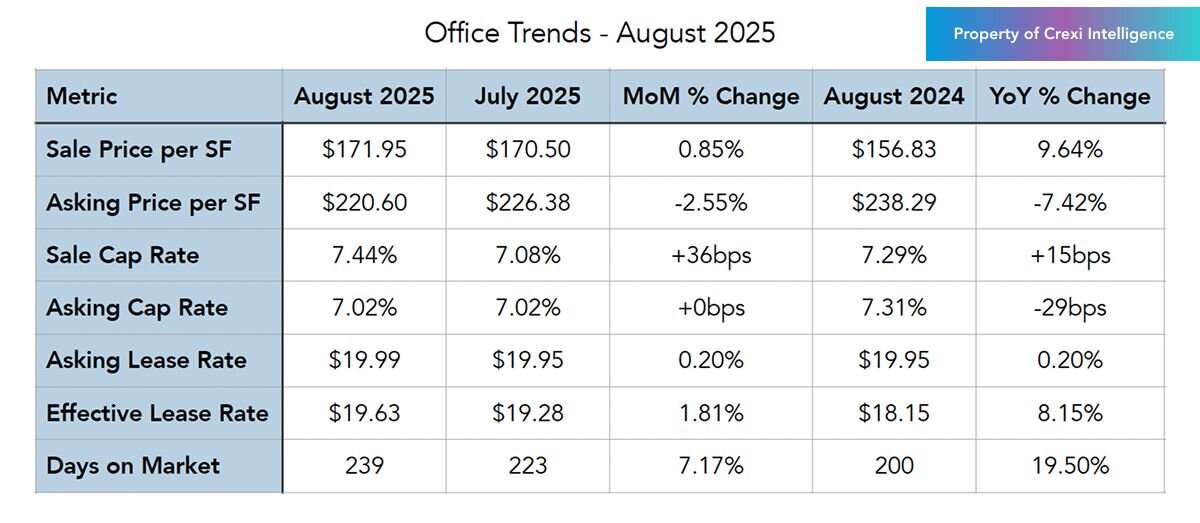
For Sale
Pricing: Median sold pricing improved to $171.95/SF in August, representing 9.64% annual growth. Even with the lift, sold values sit about well below the current median asking baseline of $220.60/SF, reflecting continued re-pricing for non-trophy assets.
Cap Rates: Sale caps rose to 7.44% (+36 bps MoM, +15 bps YoY) while asking caps stayed at 7.02%. Buyers continue to demand a premium for lease-up risk and capex exposure, even as overall valuations improve, due to continued higher for longer interest rates. We may observe this change in September should the Fed’s policy change.
Days on Market: Office properties averaged 239 days on market in August, which marked a 7.17% increase from July and a 19.50% increase year-over-year. This shows that despite some improvement in pricing and selective leasing momentum, deal cycles are taking significantly longer compared to last year, reflecting cautious underwriting and continued lender scrutiny.
For Lease
Asking vs. Effective Lease Rates: Asking ticked to $19.99/SF/yr (+0.20% MoM), while effective climbed to $19.63/SF/yr (+1.81% MoM, +8.15% YoY). Effective growth points to targeted concessions rather than broad giveaways as tenants cluster in high-spec office product, which buoys overall sector gains.
The Big Picture
Turning our attention to supply, conversions and demolitions are on pace to exceed new construction in 2025, removing an estimated 23.3 million SF across major markets. This supply reduction should gradually help availability, especially where adaptive reuse programs are active. On the other hand, national vacancy remains elevated near the 19.4% range, which continues to pressure older buildings without amenities or strong locations, particularly those with looming loan maturities.
In addition to supply dynamics, flight to quality persists. A visible example is Verizon’s larger Manhattan lease tied to stronger in-office requirements, which speaks to durable demand for prime space in transit-served cores.
Rate policy, ultimately, will matter most for cap rates and refinancing. The Fed’s July hold keeps costs steady for now, and officials have recently opened the door to possible cuts later in the year if the labor market cools further.
Industrial
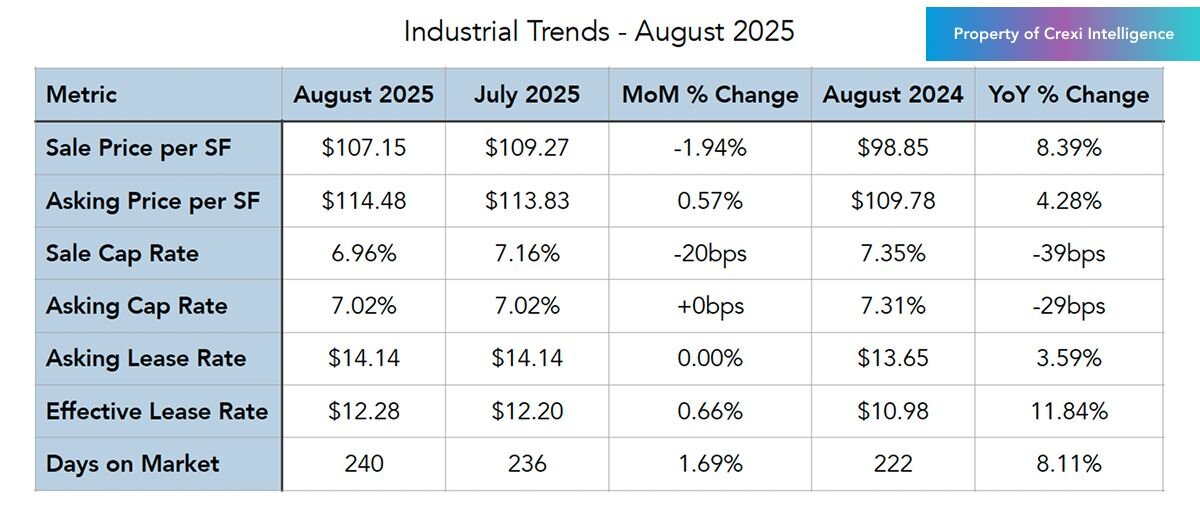
For Sale
Pricing: Median sold pricing came in at $107.15/SF (−1.94% MoM, +8.39% YoY), with the current sold figure sitting below the median asking baseline of $114.48/SF. This smaller gap reflects firmer resolve among sellers of modern logistics product, while industrial is still transacting, supply gluts and tariff-related uncertainty are limiting otherwise hearty valuation gains.
Cap Rates: Sale caps compressed to 6.96% (−20 bps MoM, −39 bps YoY) while asking caps held near 7.02%. Investors continue to pay up for newer, well-located distribution assets with strong transportation access, though we see slightly higher caps for other industrial subtypes
Days on Market: Industrial properties averaged 240 days on market in August, an 8.11% rise year-over-year. This lengthening DOM signals that while investor demand for core logistics and distribution assets remains strong, buyers are taking more time to evaluate deals, particularly in secondary markets and for properties with out-of-date specifications. The combination of higher borrowing costs, elevated new deliveries earlier in 2025, and greater scrutiny on tenant credit has stretched transaction timelines.
For Lease
Asking vs. Effective Lease Rates: Asking remained $14.14/SF/yr (flat MoM), while effective edged up to $12.28/SF/yr (+0.66% MoM, +11.84% YoY). Concessions are increasingly targeted to backfill older or smaller-bay inventory, with limited flexibility on best-in-class space.
The Big Picture
Q2 net absorption for industrial reached 29.6 million SF, even as vacancy moved higher with heavy speculative deliveries. The construction pipeline has retreated to its lowest level since 2017, which should help balance conditions headed into 2026. In addition to supply normalization, demand remains focused on modern big-box and high-throughput facilities.
Turning our attention to trade, the NRF/Hackett outlook cited in our Retail section adds uncertainty to near-term throughput and inventory positioning. Logistics providers like UPS also report front-loaded peak-season flows during tariff pauses and route shifts, which have affected short-term warehouse needs and some leasing timelines. If borrowing costs begin to ease later in 2025, we expect improved deal execution for stabilized Class A industrial.
Multifamily
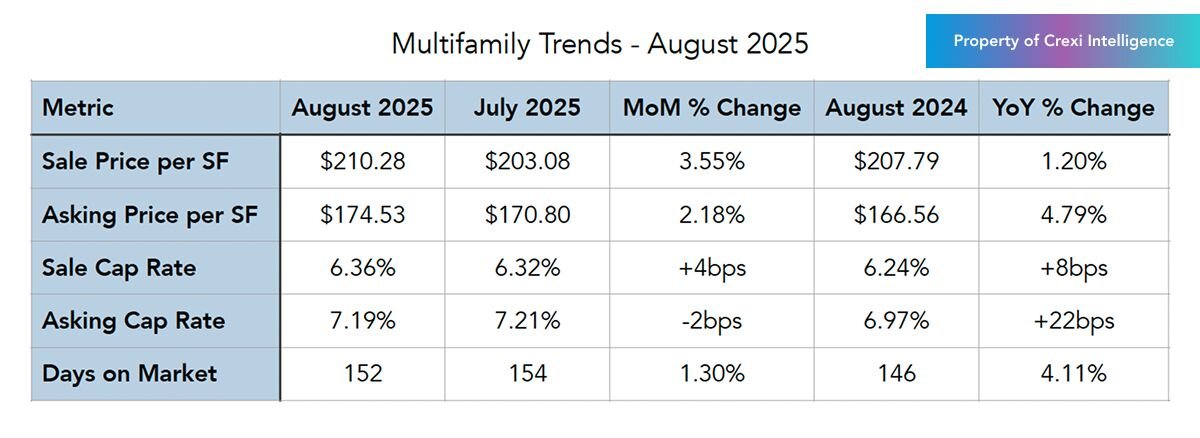
For Sale
Pricing: Median sold pricing for multifamily climbed to $210.28/SF (+3.55% MoM, +1.20% YoY). Notably, sold pricing sits about 20.48% above the current median asking baseline of $174.53/SF, which likely reflects asset mix differences, with traded properties skewing more toward stabilized or growing, well-located communities.
Cap Rates: Sale cap rates edged up slightly to 6.36% (+4 bps MoM, +8 bps YoY), while asking caps ticked down to 7.19% (−2 bps MoM, +22 bps YoY). The spread indicates ongoing price discovery and selective bidding for quality, even as multifamily proves to be a less risky investment than other asset classes amid a national housing shortage.
Days on Market: Multifamily properties averaged 152 days on market in August 2025, with a 4.11% rise year-over-year. This modest uptick suggests buyers are exercising more caution in underwriting deals, but overall sales velocity remains healthier than in the office or industrial sectors, reflecting the relative resilience of demand for well-located rental housing.
The Big Picture
National rent growth is stabilizing at low single digits, with recent readings pointing to modest monthly increases. Some coastal markets are outperforming, including San Francisco, where median rents rose roughly 11% YoY in August, driven by a tight vacancy backdrop and improved office attendance in select submarkets. In addition to local momentum in a few metros, broader affordability constraints in for-sale housing continue to support rental demand.
Complementing these findings, recent national data show steady rent levels and uneven regional performance as the 2025 supply peak works through the system. Investor activity remains selective but improving in markets with durable job growth and limited new deliveries. If the Fed transitions toward rate cuts later this year, cap-rate pressure could ease and facilitate more multifamily transactions.
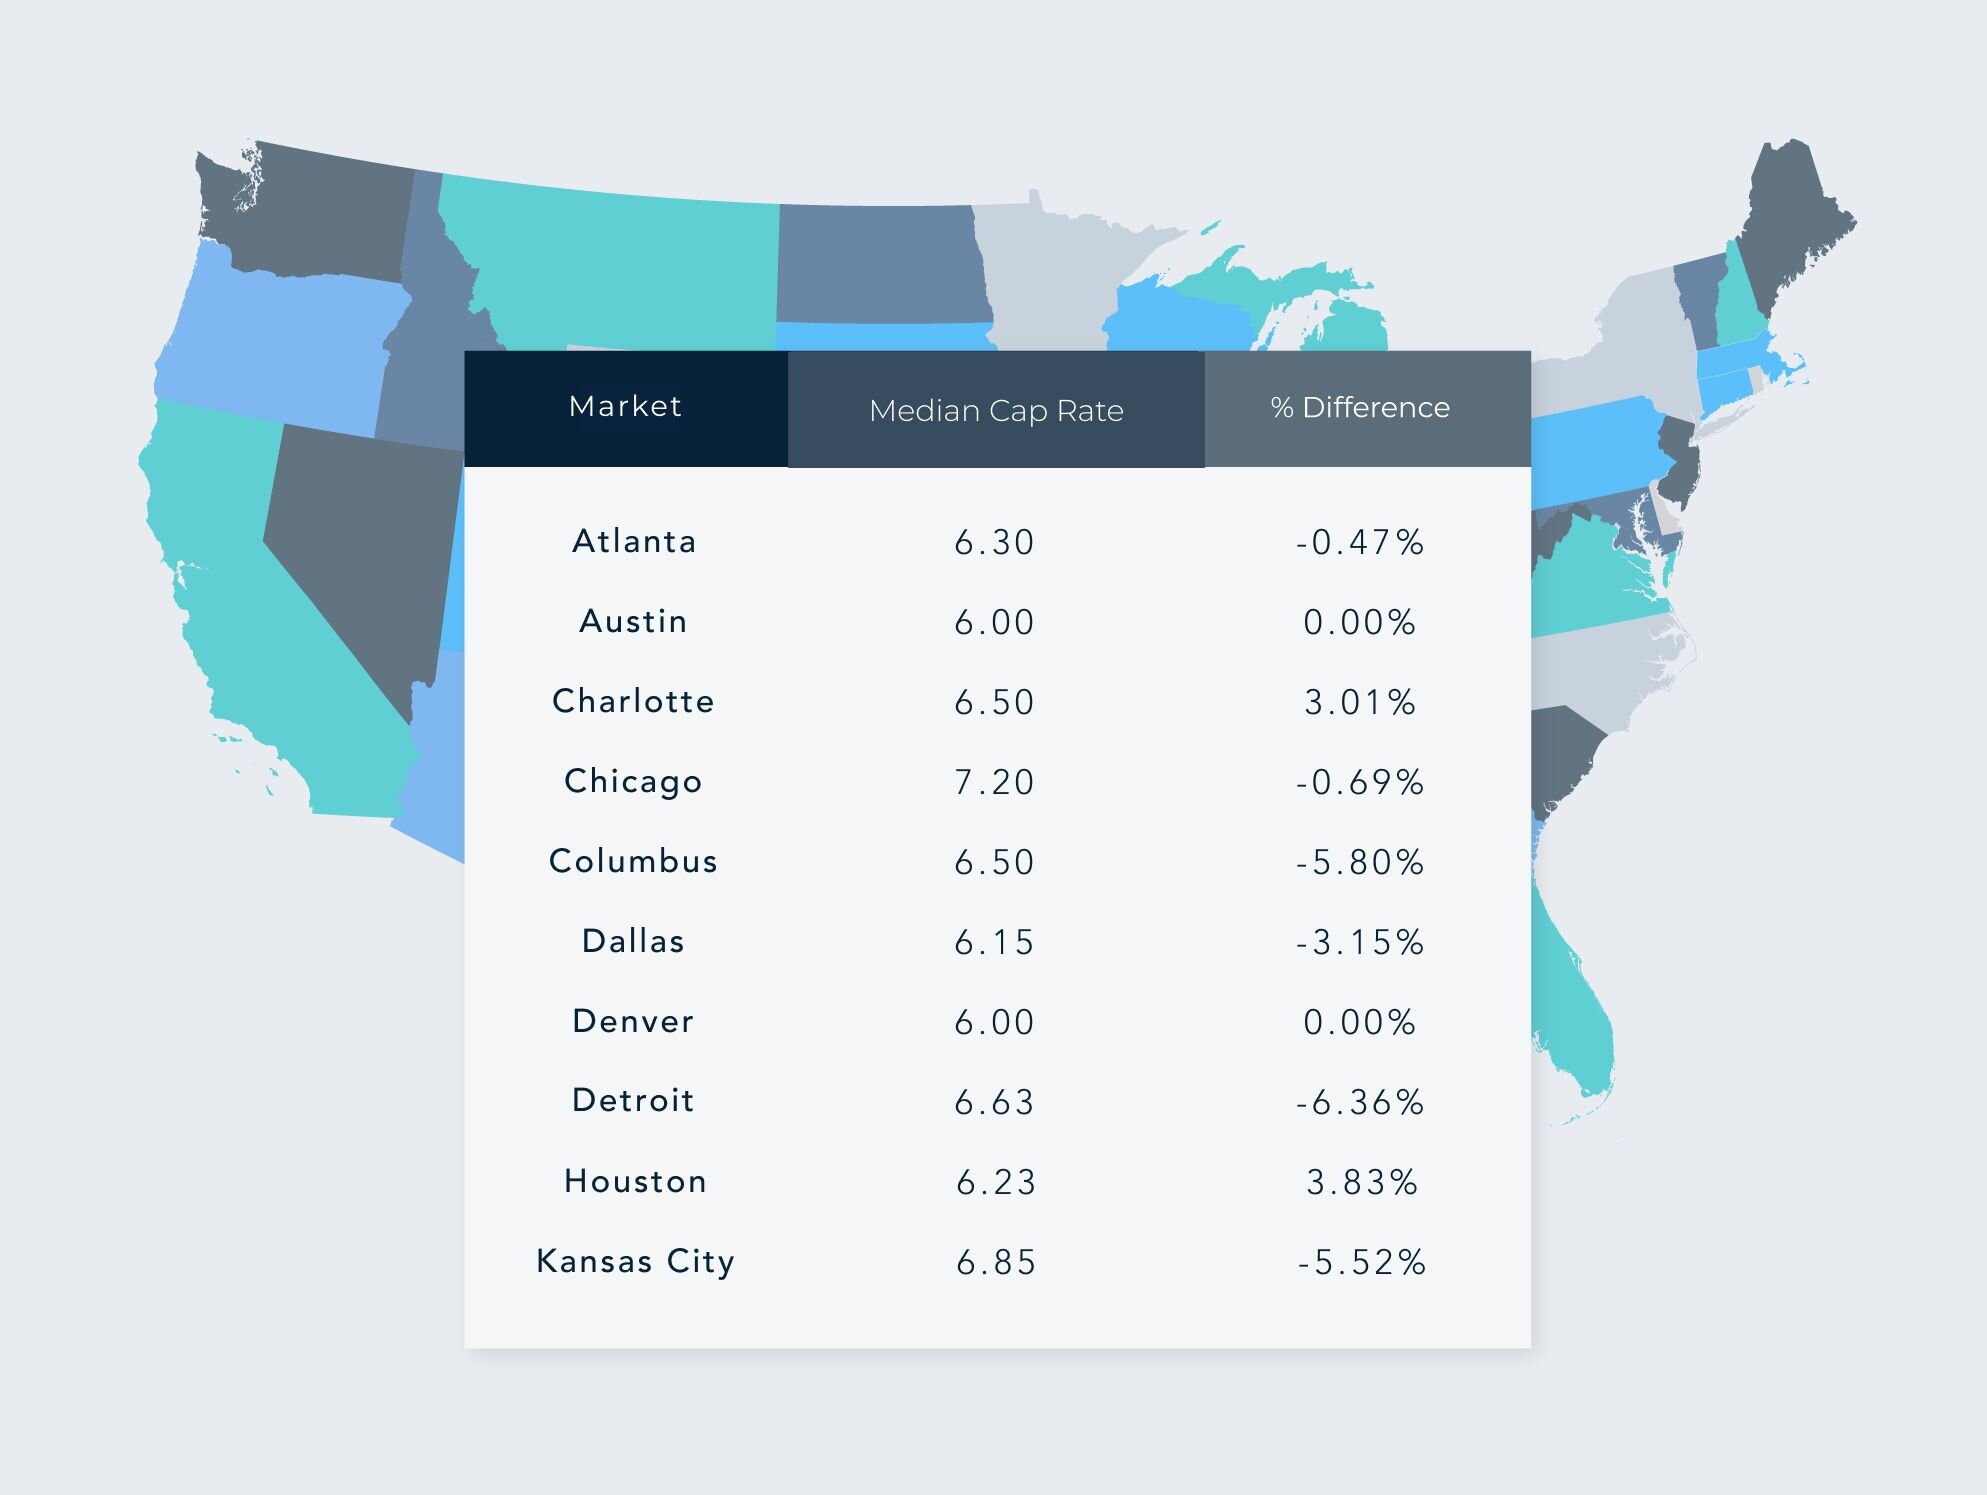
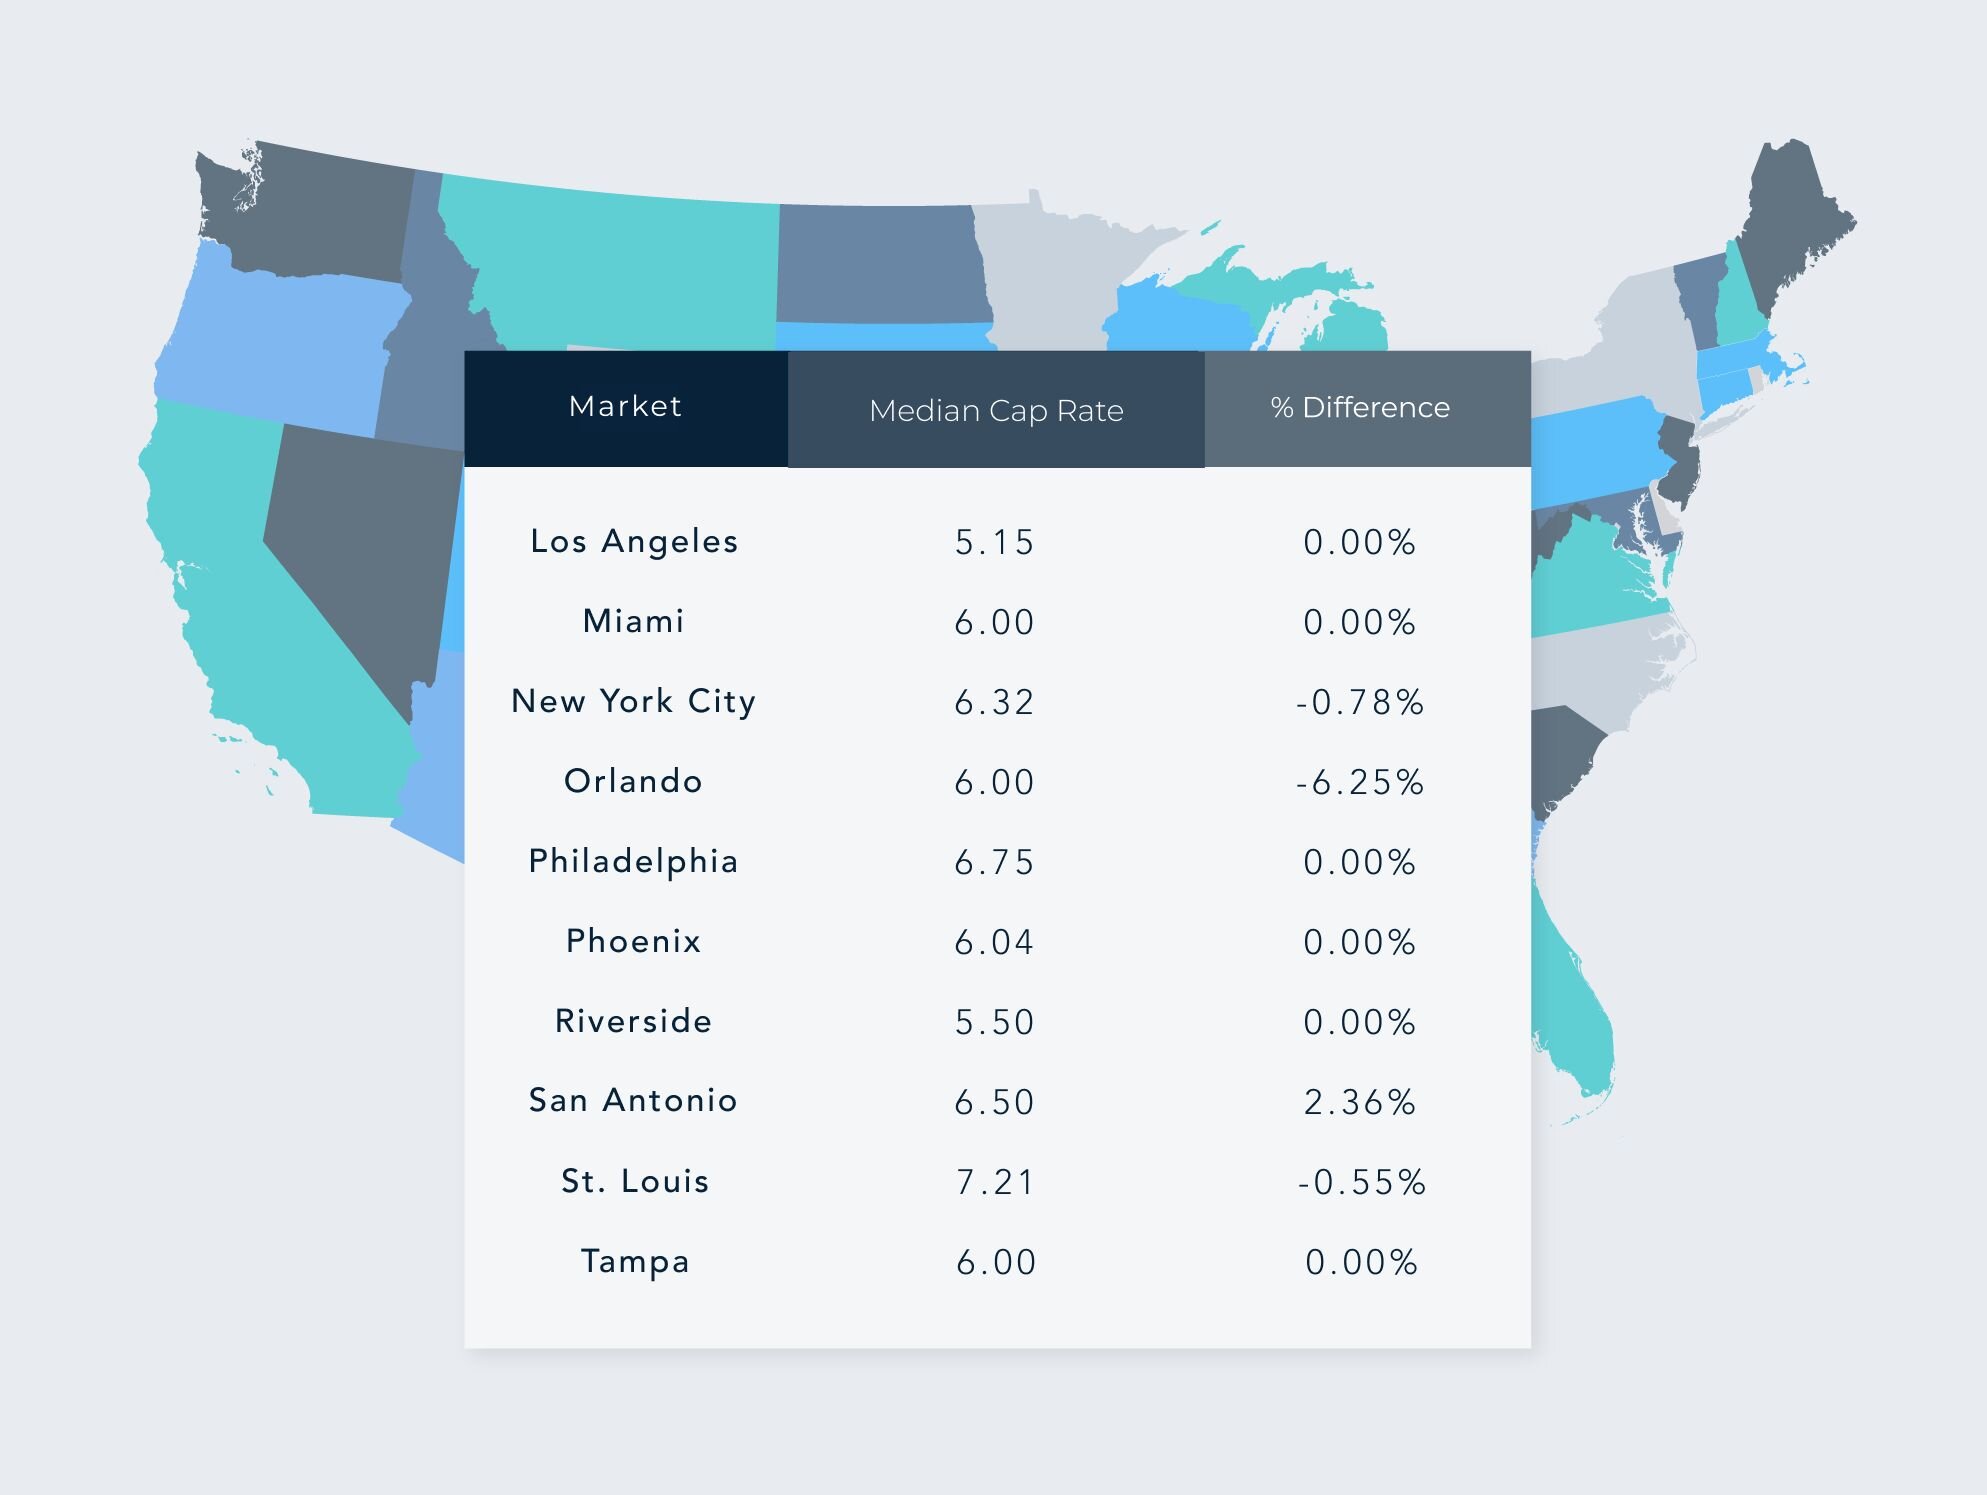
Regional Breakdown: Median Cap Rates & Changes MoM by Top MSAs – August 2025
Disclaimer: This article's information is based on Crexi's internal marketplace data and additional external sources. While asking price in many ways reflects market conditions, variations in pricing are affected by changes in inventory, asset size, etc. Nothing contained on this website is intended to be construed as investing advice. Any reference to an investment's past or potential performance should not be construed as a recommendation or guarantee towards a specific outcome.
Get more data-driven insights with Crexi Intelligence.


