Crexi National Commercial Real Estate Report: January 2025


Welcome to the January 2025 release of our Crexi Trends report. We analyze Crexi's database each month to identify relevant activity and patterns and share key insights with our users.
Our report showcases trends across Crexi's commercial property listings in January, evaluating average price per square foot, search behavior, occupancy, and other noteworthy metrics. With this information, we aim to arm commercial real estate professionals with actionable learnings to make well-informed commercial real estate decisions.
Retail
For Sale
Pricing: In January 2025, the median asking price per square foot for retail properties was $262.29, reflecting a slight year-over-year decrease of 0.32%. While the decline was marginal, retail pricing followed a steady arch of growth in H1 and then declined in the second half of 2024.
Cap Rates: The median cap rate for retail properties stood at 6.55%, indicating a 1.31% increase compared to the previous year while remaining the lowest across all asset types on Crexi. This uptick may point to a modest rise in perceived investment risk or adjustments in investor return expectations within the retail sector. It may also reflect broader concerns about tariff and other regulatory impact on consumer behaviors.
Absorption: The absorption rate for retail properties was 1.07%, which was the lowest among asset classes on Crexi. This suggests that while retail commands the highest asking price, assets sold at a slower clip than potentially higher-risk investment options.
For Lease
Asking vs. Effective Lease Rates: The median annual asking lease rate for retail spaces was $18.36 per square foot, while the median effective lease rate was $18.97 per square foot, with effective rates approximately 3.3% higher than asking rates. Tenants continue to be willing to pay above the asking price to secure desirable retail locations, but the gap is closing as retailer uncertainty slows down decision-making.
Broader Trends
The retail sector has demonstrated resilience, with stable occupancy rates and modest growth in lease rates. As an example, Simon Property Group reported funds from operations (FFO) of $3.68 per share in Q4 2024, surpassing market expectations, driven by steady leasing demand at U.S. malls and premium outlets. The company’s occupancy rate increased to 96.5% from 95.8% the previous year, and the base minimum rent per square foot rose by 2.5% to $58.26.
Furthermore, the U.S. Real Estate Market Outlook 2025 by CBRE anticipates continued growth in the retail sector, supported by consumer spending and easing financial conditions. The report suggests that retail and data centers have been bolstered by longer-term trends, with all other real estate sectors expected to see the start of a new cycle.
However, the Trump administration’s recent threat of tariffs (25% on imports from Mexico and Canada, and 10% on Chinese goods) has raised concerns about potential price increases for a variety of consumer products, including food, electronics, and automobiles. Economists warn that these higher costs could lead to reduced consumer spending, which may negatively impact the retail sector.
Additionally, the administration’s aggressive trade policies have contributed to a decline in consumer confidence. A University of Michigan survey reported a 5% drop in consumer sentiment, reaching its lowest point since July 2024. This growing unease among consumers could result in decreased retail sales, thereby affecting demand for retail commercial real estate.
Office
For Sale
Pricing: The median asking price per square foot for office properties was $230.28 in January 2025, marking a 13.11% increase year-over-year. This significant rise indicates a renewed investor confidence and a potential rebound in office property valuations, especially with an increase in mandated return-to-office policies.
Cap Rates: The median cap rate for office properties was 7.12%, showing a slight decrease of 0.42% from the previous year. This marginal decline suggests that while office investments still seem risky, greenshoots are indicating a potential turning point in office recovery.
For Lease
Asking vs. Effective Lease Rates: The median annual asking lease rate for office spaces was $19.99 per square foot, while the median effective lease rate was $19.40 per square foot, indicating that effective rates were approximately 3% lower than asking rates. While effective leasing rates are down from last January’s $19.93 per square foot, this could indicate that Class B and C offices are starting to attract more tenant attention, versus their fancier Class A counterparts.
Broader Trends
The office sector is experiencing a slow, cautious recovery. Investors are returning to the U.S. office market after years of turmoil, with sales activity increasing to $63.6 billion in 2024, a 20% rise from 2023. This renewed interest is driven by factors such as opportunistic purchases of undervalued buildings and foreign investors seeking early advantages. Real estate activity is expected to rise in 2025 as businesses require more office space for returning workers and premium office buildings experience shortages and rent hikes.
However, the Washington, D.C. office market faces new challenges under the Trump administration’s plans to reduce the federal workforce and cut government spending. These proposals could lead to significant downsizing in the federal office portfolio, impacting demand for office space, especially from nonprofit organizations and government contractors reliant on federal support. Despite positive trends in office leasing observed in 2024, with government agencies and nonprofits being major contributors, these initiatives could undermine this progress.
Industrial
For Sale
Pricing: In January 2025, the median asking price per square foot for industrial properties on Crexi was $109.39, reflecting a 7.26% decrease year-over-year. This decline may be attributed to market corrections following previous rapid growth or an increase in available industrial inventory hitting the market.
Cap Rates: The median cap rate for industrial properties was 7.34%, the highest on Crexi among asset classes and posting a 9.25% increase compared to the previous year. This rise suggests a shift in perceived risks or changing market dynamics within the industrial sector, attributed to slower occupancy gains and new inventory arriving with higher vacancy than previous deliveries.
For Lease
Asking vs. Effective Rates: The median annual asking lease rate for industrial spaces was $13.73 per square foot, while the median effective lease rate was $12.26 per square foot, with effective rates approximately 10.7% lower than asking rates. However, effective lease rates have been rising for the last three consecutive months, pointing towards potential increased competition among tenants for choice leases even as more supply becomes available.
Broader Trends
The industrial real estate sector is experiencing a stabilization in demand, returning to pre-pandemic drivers such as e-commerce growth and increased reliance on third-party logistics providers. According to CBRE’s U.S. Real Estate Market Outlook 2025, industrial occupiers are focusing on long-term strategies to enhance warehouse efficiency and ensure supply chain resiliency. However, the sector faces challenges, including a shortage of development-ready industrial sites, which could impede new projects and limit growth opportunities. A survey by the Site Selectors Guild highlighted that nearly two-thirds of site selectors identified the scarcity of suitable sites as a primary obstacle to development.
Despite these challenges, rental rates for industrial spaces remain elevated. Developers have limited new construction, restricting supply and keeping prices high. In the fourth quarter of 2024, average asking rents in the U.S. reached $10.13 per square foot, a 61% increase from the same period in 2019. This trend persists even as the average warehouse vacancy rate rose to 6.7%, indicating that demand, while stabilizing, continues to support high rental rates. Additionally, the rise of artificial intelligence and data center construction is contributing to increased competition for suitable industrial land, further influencing market dynamics.
Multifamily
For Sale
Pricing: In January 2025, the median asking price per square foot for multifamily properties was $164.44, showing a negligible decrease of 0.01% year-over-year. This stability suggests that multifamily property valuations have remained consistent over the past year, proving out its resilience amidst uncertain market dynamics.
Cap Rates: The median cap rate for multifamily properties was 7.04%, reflecting a 1.62% increase from the previous year. This uptick may indicate a slight rise in perceived investment risk or adjustments in investor return expectations within the multifamily sector, more impacted by outside capital-related costs than fundamentals within the sector itself.
Absorption: The absorption rate for multifamily properties was 1.30%, indicating healthy demand in the market. This positive absorption rate suggests that multifamily units are being occupied at a steady pace, reflecting sustained interest from renters.
Broader Trends
The multifamily sector continues to attract investors, driven by ongoing demand for rental housing. In New York City, there is a growing trend of converting former office spaces into residential apartments, addressing the rising demand for housing. Notable conversions include luxury apartments at 55 Broad Street and the extensive transformation of 25 Water Street. These projects aim to meet housing needs while repurposing underutilized office spaces, but face their own set of challenges meeting proper building codes, zoning rules, and other roadblocks.
Additionally, the U.S. Real Estate Market Outlook 2025 by CBRE anticipates that developers will add more multifamily units to the U.S. housing market than in any period since the 1970s. The average multifamily vacancy rate is expected to end 2025 at 4.9%, with average annual rent growth at 2.6%. Most of this new supply will be in the Sun Belt and Mountain regions, where some markets will grow their inventories by nearly 20% in just a three-year period.
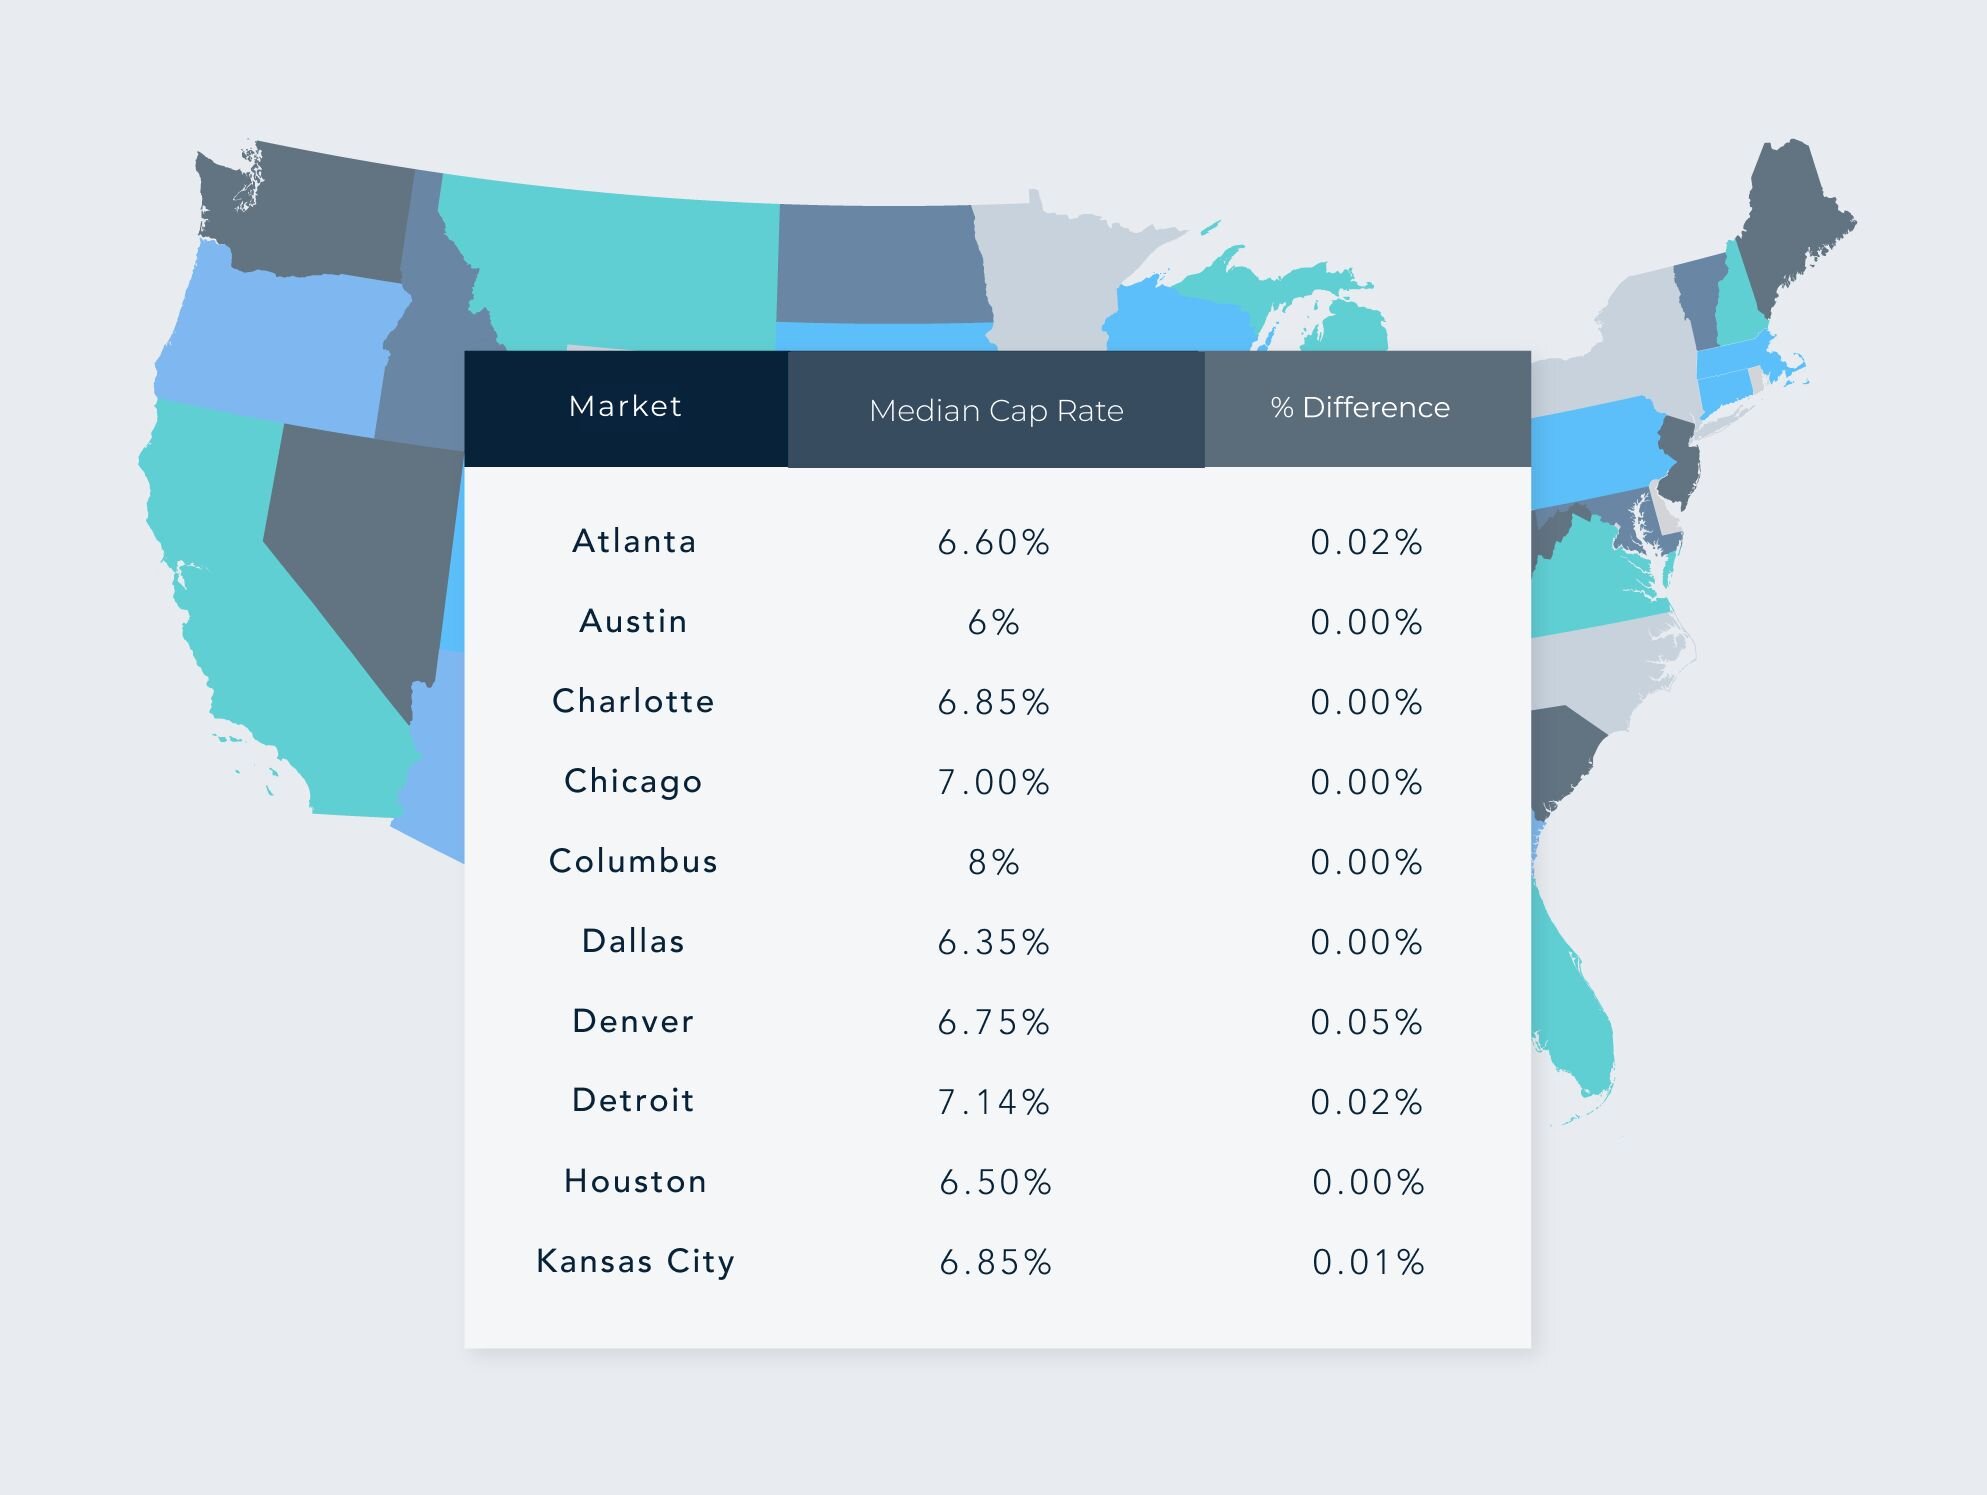
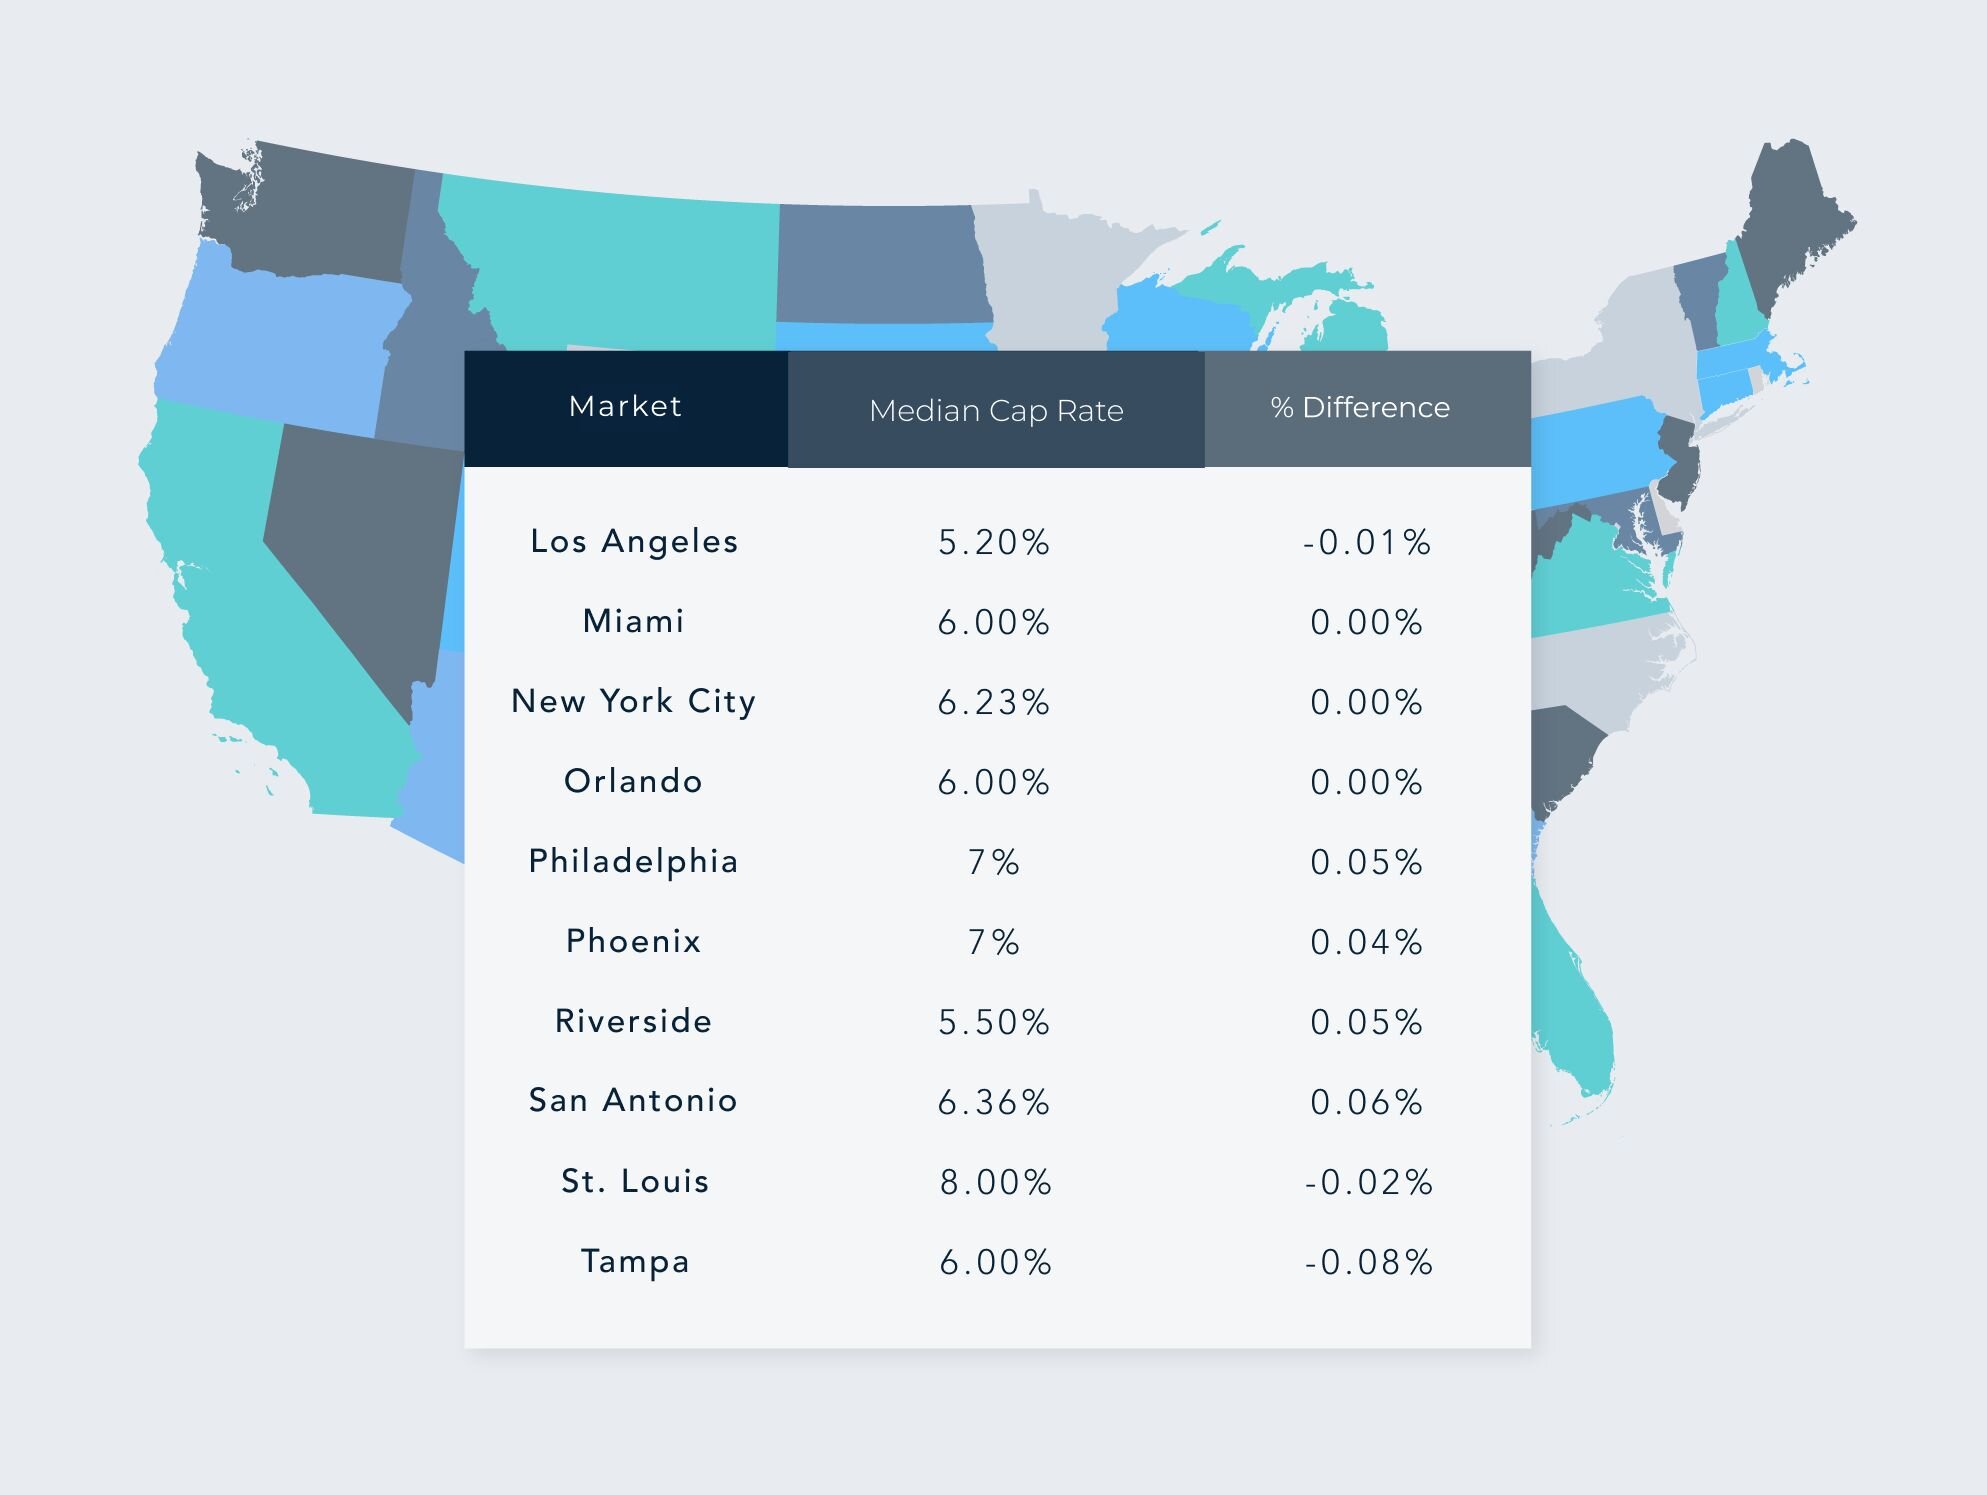
Regional Breakdown: Median Cap Rates & Changes by Top MSAs – January 2025


Disclaimer: This article's information is based on Crexi's internal marketplace data and additional external sources. While asking price in many ways reflects market conditions, variations in pricing are affected by changes in inventory, asset size, etc. Nothing contained on this website is intended to be construed as investing advice. Any reference to an investment's past or potential performance should not be construed as a recommendation or guarantee towards a specific outcome.
Get more data-driven insights with Crexi Intelligence.


