Crexi National Commercial Real Estate Report: July 2025

Welcome to the July 2025 release of our Crexi Trends report. We analyze Crexi's database each month to identify relevant activity and patterns and share key insights with our users.
This national commercial real estate market update, based on Crexi Intelligence data and commercial property listings, highlights key CRE pricing, leasing, and investment trends from July 2025. With this information, we aim to arm commercial real estate professionals with actionable learnings to make well-informed commercial real estate decisions.
Key Takeaways
- Historic office transformation - Conversions and demolitions (23.3M sq ft) exceeded new construction for the first time in 25 years, with 8,300+ NYC apartment units planned from office conversions
- Industrial market rebalancing - Vacancy peaked at 23.3% but construction dropped 60%, signaling potential supply-demand correction in late 2025
- Multifamily resilience continues - Strong 1.36% absorption rate with rent growth accelerating in high-cost markets like San Francisco (+11% YoY)
- Selective investment recovery - Office pricing up 8.37% annually in premium locations while retail shows unexpected strength with effective lease rates exceeding asking rates
Retail
For Sale
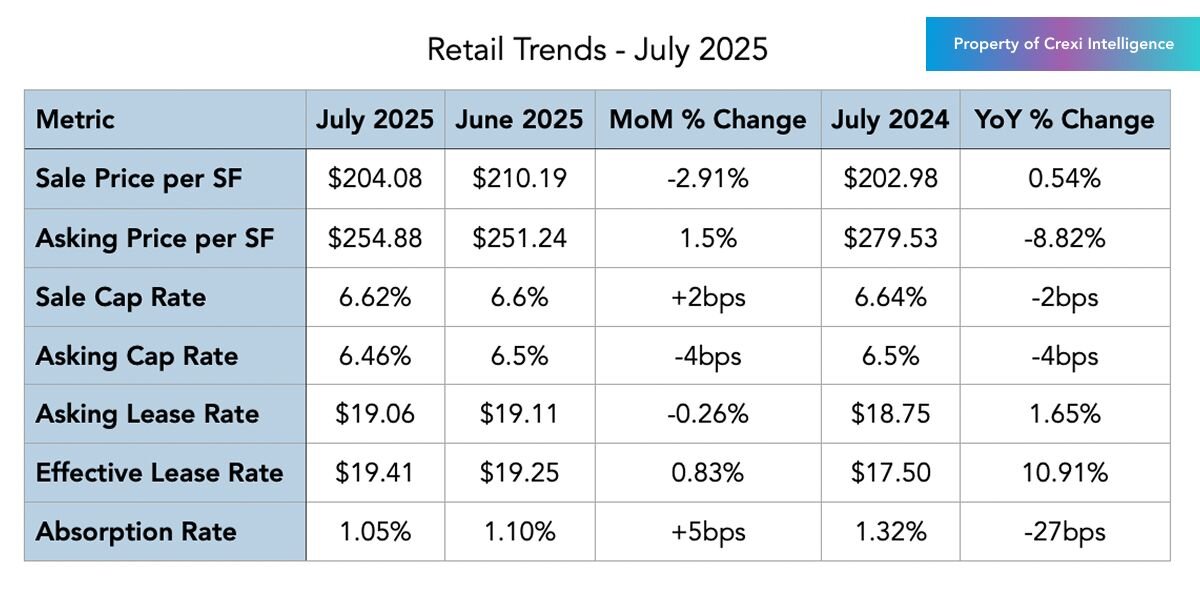
Pricing: Retail sale prices averaged $204.08 per square foot, up slightly by 0.54% from last year, although down month-over-month from June’s $210.19 highs. This highlights cautious buyer sentiment amid macro-trend uncertainties and continuing negotiation between buyer and seller expectations.
Cap Rates: Asking cap rates dipped slightly to 6.46%, indicating marginally increasing seller confidence in market valuations. However, retail median sold cap rates haven’t budged much since Q2, indicating a tight investment market with decent competition among would-be buyers.
Absorption: The absorption rate of 1.05% in July marks a moderate pace of sales relative to new listings; retail is among Crexi’s largest asset classes, with these numbers indicating relatively stable transaction activity despite broader economic pressures.
For Lease
Asking vs. Effective Lease Rates: Retail asking lease rates averaged $19.06 per square foot, slightly lower than the effective rate of $19.41 in July. The year-over-year rise in effective lease rates suggests decreased landlord concessions due to strong tenant demand, in spite of market uncertainties.
The Big Picture
Retail in July 2025 remains under pressure from macroeconomic headwinds and policy-driven uncertainty, despite its 2024 performance as a darling, resilient asset class. Core retail sales rose only 0.6% in June, narrowly beating expectations, but consumer sentiment continued to soften according to analyst projections.
Consumer spending growth is expected to slow further as inflation and tariffs weigh on disposable income. Still, the National Retail Federation projected 2025 retail sales growth of 2.7–3.7% year‑over‑year in April, in line with pre‑pandemic momentum, signaling resilience amid uncertainty, and has yet to revise these numbers.
While market sentiment on retail is uncertain, buyers who are ready to act are diving in on desirable assets. Investors continue to favor necessity-based assets, who have proven out resilience to tariffs and other economic uncertainties. Retail vacancy rates remain low, putting upward pressure on asking rents, especially in infill nodes and power centers.
Despite broader headwinds, adaptive strategies are gaining traction. San Antonio is experiencing its strongest retail construction pipeline since 2019, with over 607,000 square feet of new space in development alongside maintained occupancy above 95%. Additionally, General Dynamics Electric Boat’s acquisition and repurposing of a former Macy’s store in Connecticut underscores the growing trend of transforming vacant retail into industrial or mixed‑use configurations.
Office
For Sale
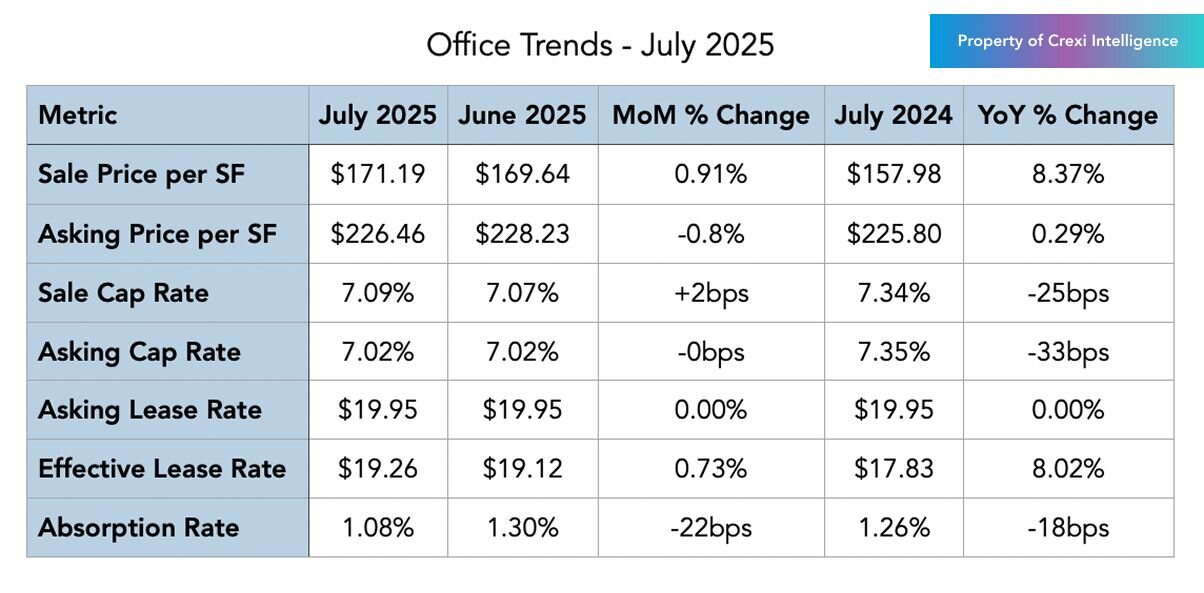
Pricing: Office sale prices reached $171.19 per square foot, an 8.37% annual increase, reflecting recovering investor interest in high-quality urban locations. However, asking prices at $226.46 and a month-over-month decline highlight the ongoing valuation gaps between buyers and sellers.
Cap Rates: Office median sale cap rates stood at 7.09%, down 25 basis points annually. Asking cap rates remained steady at 7.02%, suggesting cautious yet positive sentiment. Both metrics trending downward point to healthier seller confidence in the sector, as more macroeconomic trends support office recovery.
For Lease
Asking vs. Effective Lease Rates: Office asking lease rates averaged $19.95 per square foot, with effective rates slightly lower at $19.26. Landlords continue to strategically manage concessions to maintain occupancy rates in competitive markets, and those with Class B and C are being required to get more creative with lease terms to attract potential tenants.
The Big Picture
The U.S. office market continues to navigate a high vacancy environment, with the national rate around 19.9% in June according to Crexi Intelligence data. Construction activity has dropped to the lowest level in years, while loan maturities due by 2027 are creating pressure on distressed assets, with over 40% of loans coming due in secondary metro areas like Chicago and Atlanta.
At the same time, the sector is undergoing its most significant structural shift in decades. Office conversions and demolitions total over 23.3 million square feet in 2025, surpassing new construction for the first time in 25 years. This reflects a rapidly growing trend of adaptive reuse projects turning older or underutilized office buildings into residential or mixed-use properties. New York City alone is planning more than 8,300 apartment units from office conversions in 2025, including the 5 Times Square project, which will create 1,250 new units .
But not all office markets remain weak, with a growing number of major firms boosting in-office mandates. Verizon’s lease of 200,000 square feet near Penn Station, as part of a three-day-a-week work policy for managers, demonstrates renewed demand in top-tier locations. This is reflected in the early stages of a broader stabilization trend where flight-to-quality assets in urban centers like Manhattan remain relatively resilient due to limited new supply and steady leasing activity.
Industrial
For Sale
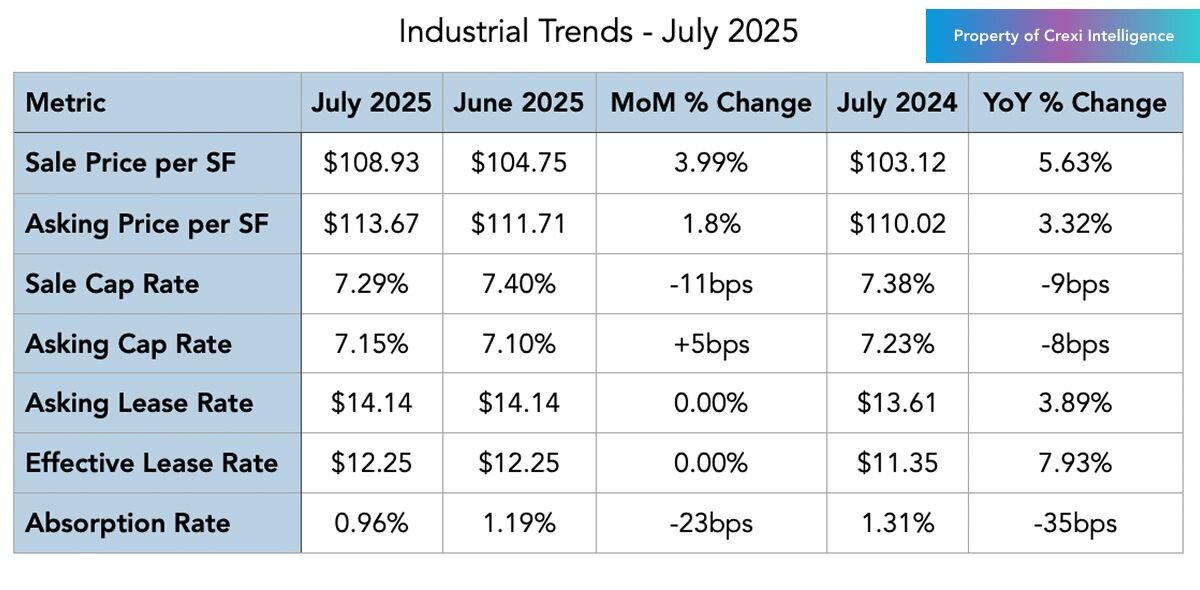
Pricing: Industrial property sale prices increased by 5.63% year-over-year to $108.93 per square foot. The moderate month-over-month growth indicates stable demand tempered by increasing supply and cautious investor evaluations.
Cap Rates: Industrial sale cap rates slightly decreased to 7.29% while asking cap rates rose slightly to 7.15%; buyers and sellers are adjusting still to market shifts, including near-shoring policy initiatives and the yet-unseen impact of tariffs on logistics sectors.
For Lease
Asking vs. Effective Lease Rates: Industrial asking lease rates averaged $14.14 per square foot, while effective rates remained significantly lower at $12.25, likely due to peak supply deliveries in the last year and a growing cohort of properties no longer meeting tenant demands.
The Big Picture
The U.S. industrial real estate market is undergoing an extended challenge in mid‑2025, with vacancy rates on Crexi reaching approximately 23.3%, similar to its vacancy on Crexi year-over-year. This stagnancy reflects a continued mismatch; net absorption in Q2 totaled 29.6 million square feet, and while more than 71 million square feet of new space was delivered, most of it speculative and unleased upon completion.
Lower-tier and older assets are under leasing pressure despite strong demand for Class A product, particularly from logistics and third-party distribution users. Construction activity has dropped sharply—down nearly 60%, aligning levels with early 2019—as developers recalibrate amid weakened leasing momentum. As such, we expect vacancy to have reached its peak and see more promising occupancy signs in the latter half of 2025.
Large-scale users continue to demand modern, build-to-suit facilities, and investors like Prologis and Brookfield remain active. Prologis initiated $900 million in new projects in Q2, with 65% pre-leased, targeting warehouses in logistics-rich metro areas. Brookfield’s recent $428 million acquisition of a 53-property portfolio demonstrates continued interest in older but high‑occupancy assets appealing to cost-conscious tenants. Trade policy uncertainty and tariff effects have delayed speculative leasing, but occupiers that do engage are prioritizing modern, efficient facilities.
Multifamily
For Sale
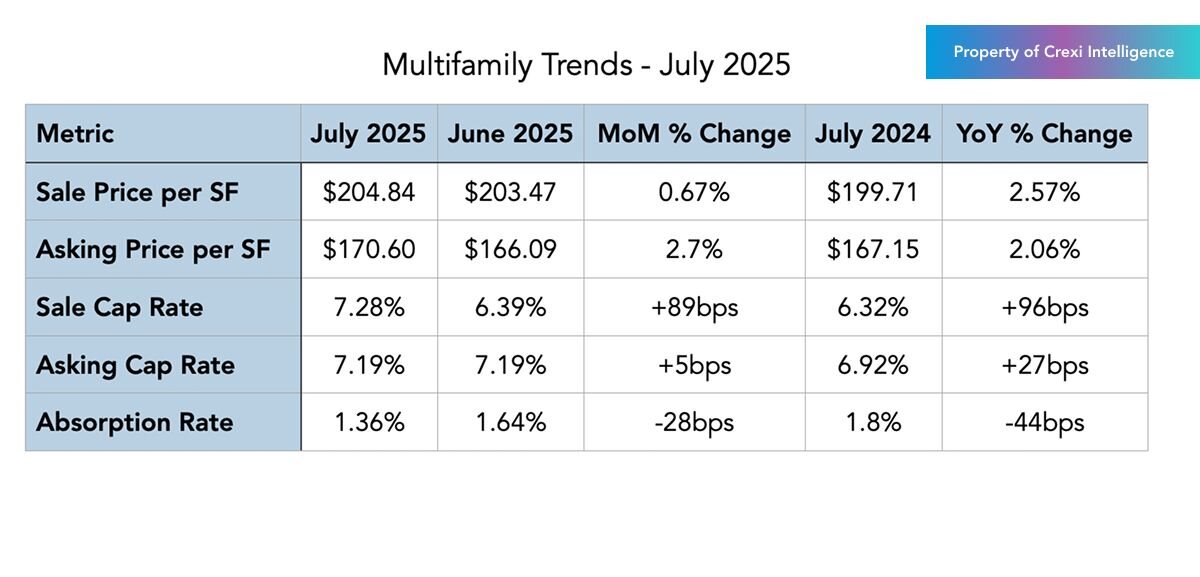
Pricing: Multifamily sale prices rose 2.57% year-over-year, reaching $204.84 per square foot in July. Stable investor interest in affordable and workforce housing continues to support pricing.
Cap Rates: Sale cap rates slightly declined to 6.28%, while asking cap rates increased to 7.19%, indicating continued price discovery influenced by higher-for-longer interest rates. Should the cost of capital come down, we may see a closer meeting of returns on high-demand multifamily assets that will float transaction volume.
Absorption: Multifamily assets saw a robust absorption rate of 1.36%, reflecting consistent demand driven by demographic factors and affordability constraints in homeownership.
The Big Picture
The multifamily sector remains fundamentally resilient in mid-2025, even as new supply peaks abate. Analysts have revised projections due to more subdued demand for 2025, and the market seems on track for a projected vacancy rate near 4.9% by year-end.. Rent growth exists but remains modest, rising about 1.5% year-over-year, though metros like New York and Kansas City continue to outperform due to constrained supply.
In June, however, multifamily construction surged 30% month-over-month to nearly 438,000 units annualized, despite permitting and completion variability signals uneven momentum ahead. And investors are still bullish on the sector, with sales volume reaching $35.1 billion in Q2 (though down 14% year-over-year) with Dallas alone accounting for $5.6 billion in investment activity.
Meanwhile, rent growth is expected to accelerate longer-term as supply declines and home ownership affordability challenges persist. Roughly 35% of prospective movers prefer renting over buying given high mortgage rates (7%) and monthly cost differentials ($440 more to buy than rent). Locally, VHCOL areas like San Francisco saw rents surge 11% year-over-year in June, with intense competition and limited inventory fueling a landlord-favored market. Build-to-rent product in suburban markets is also gaining traction as renters seek single-family-like amenities without ownership responsibilities.
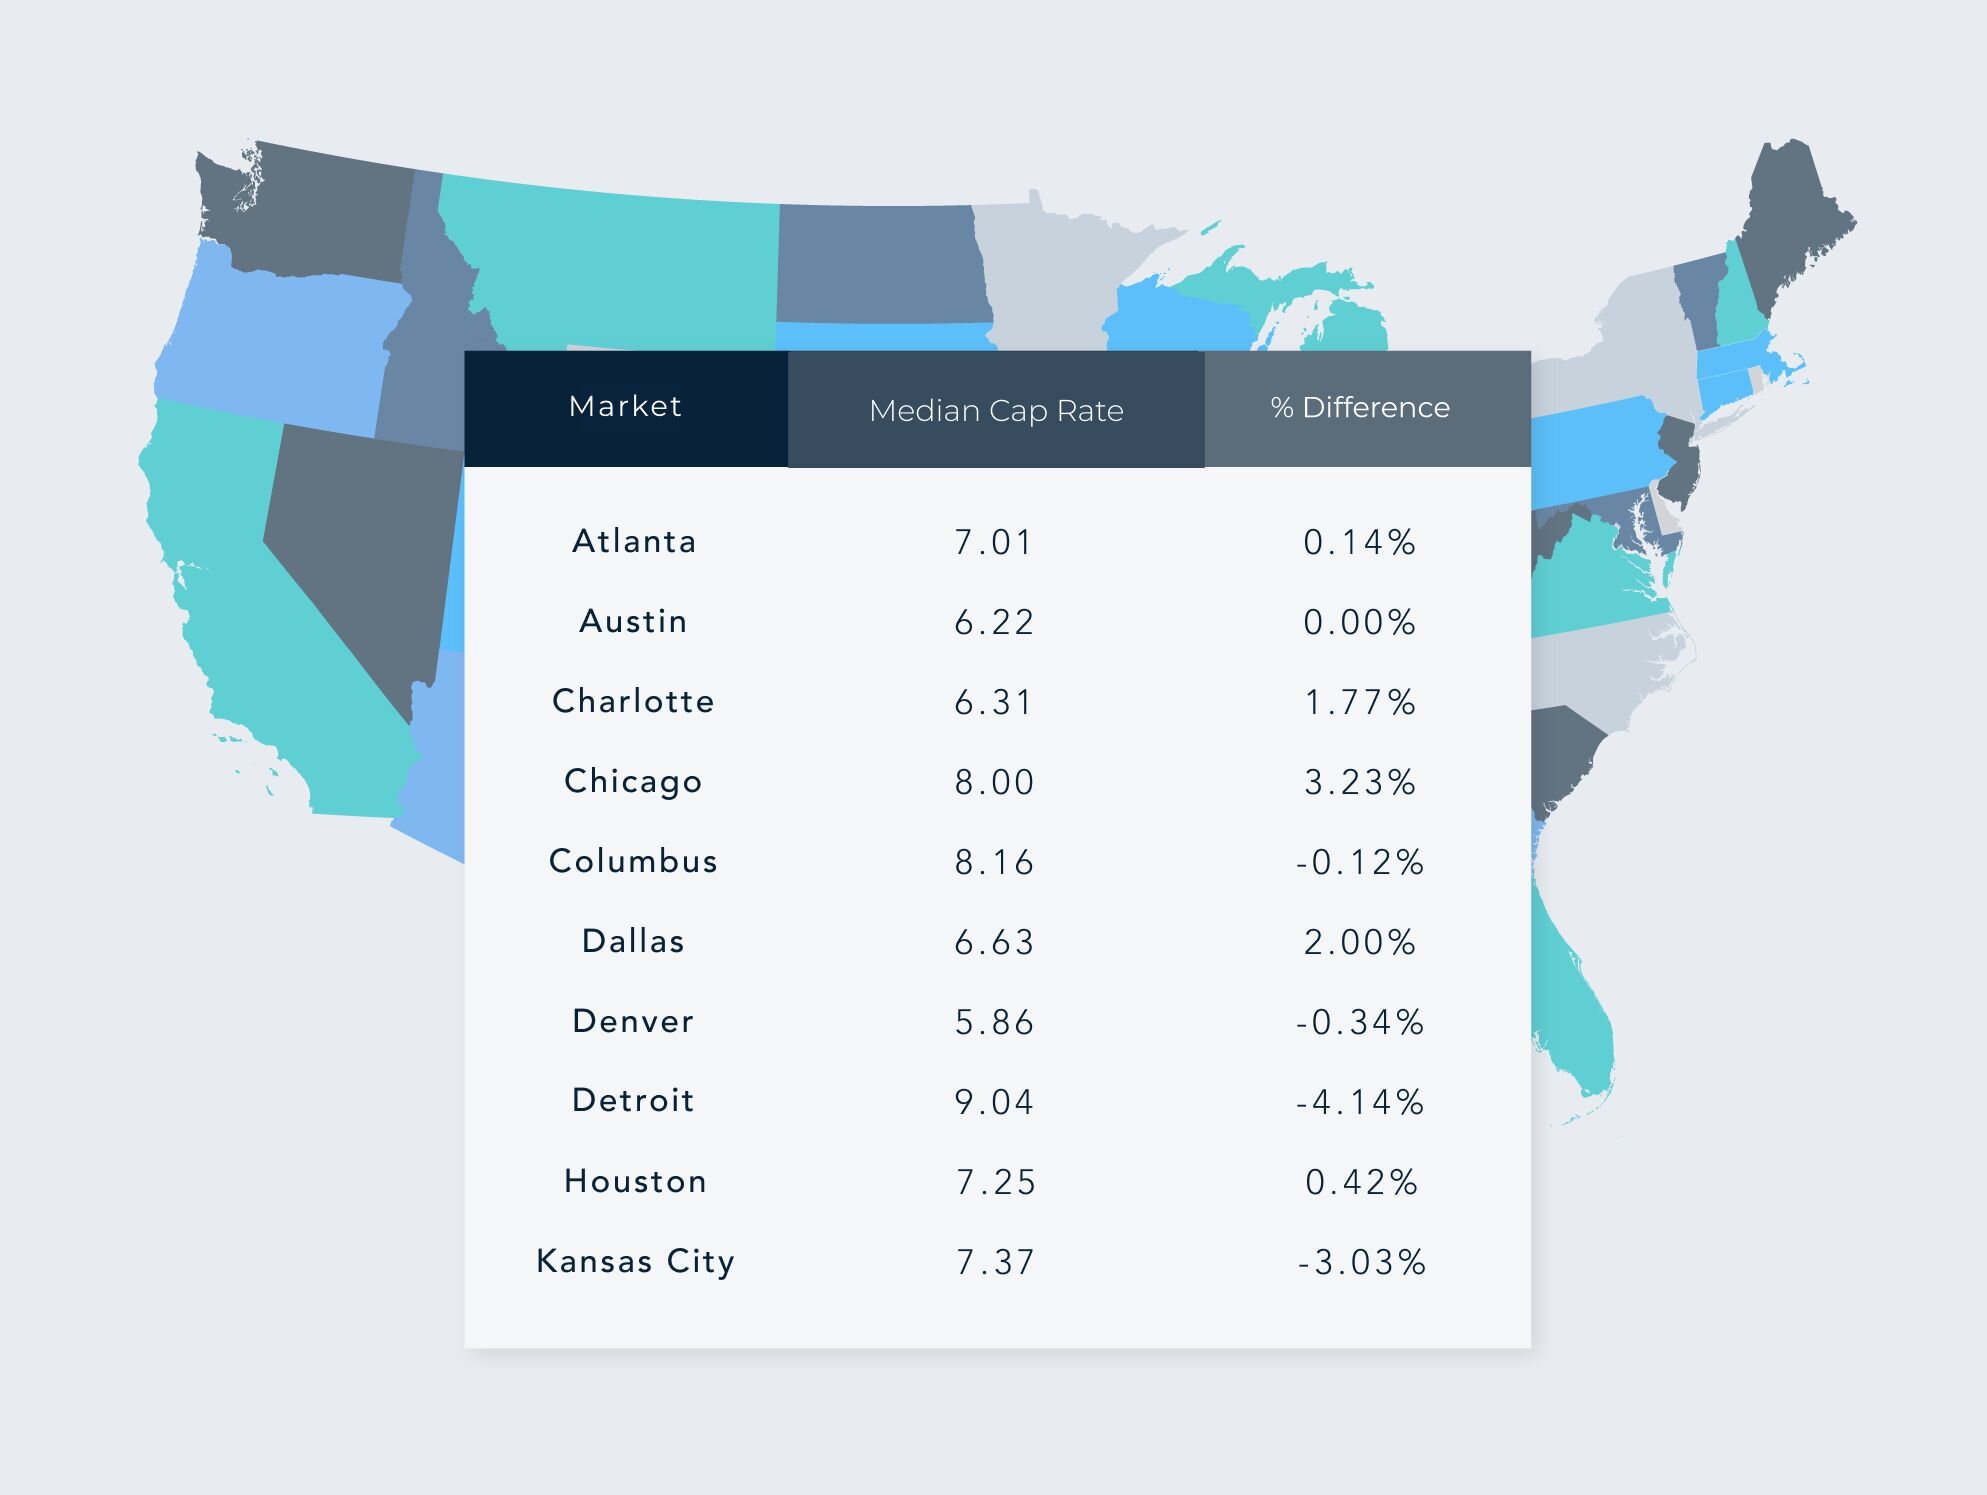
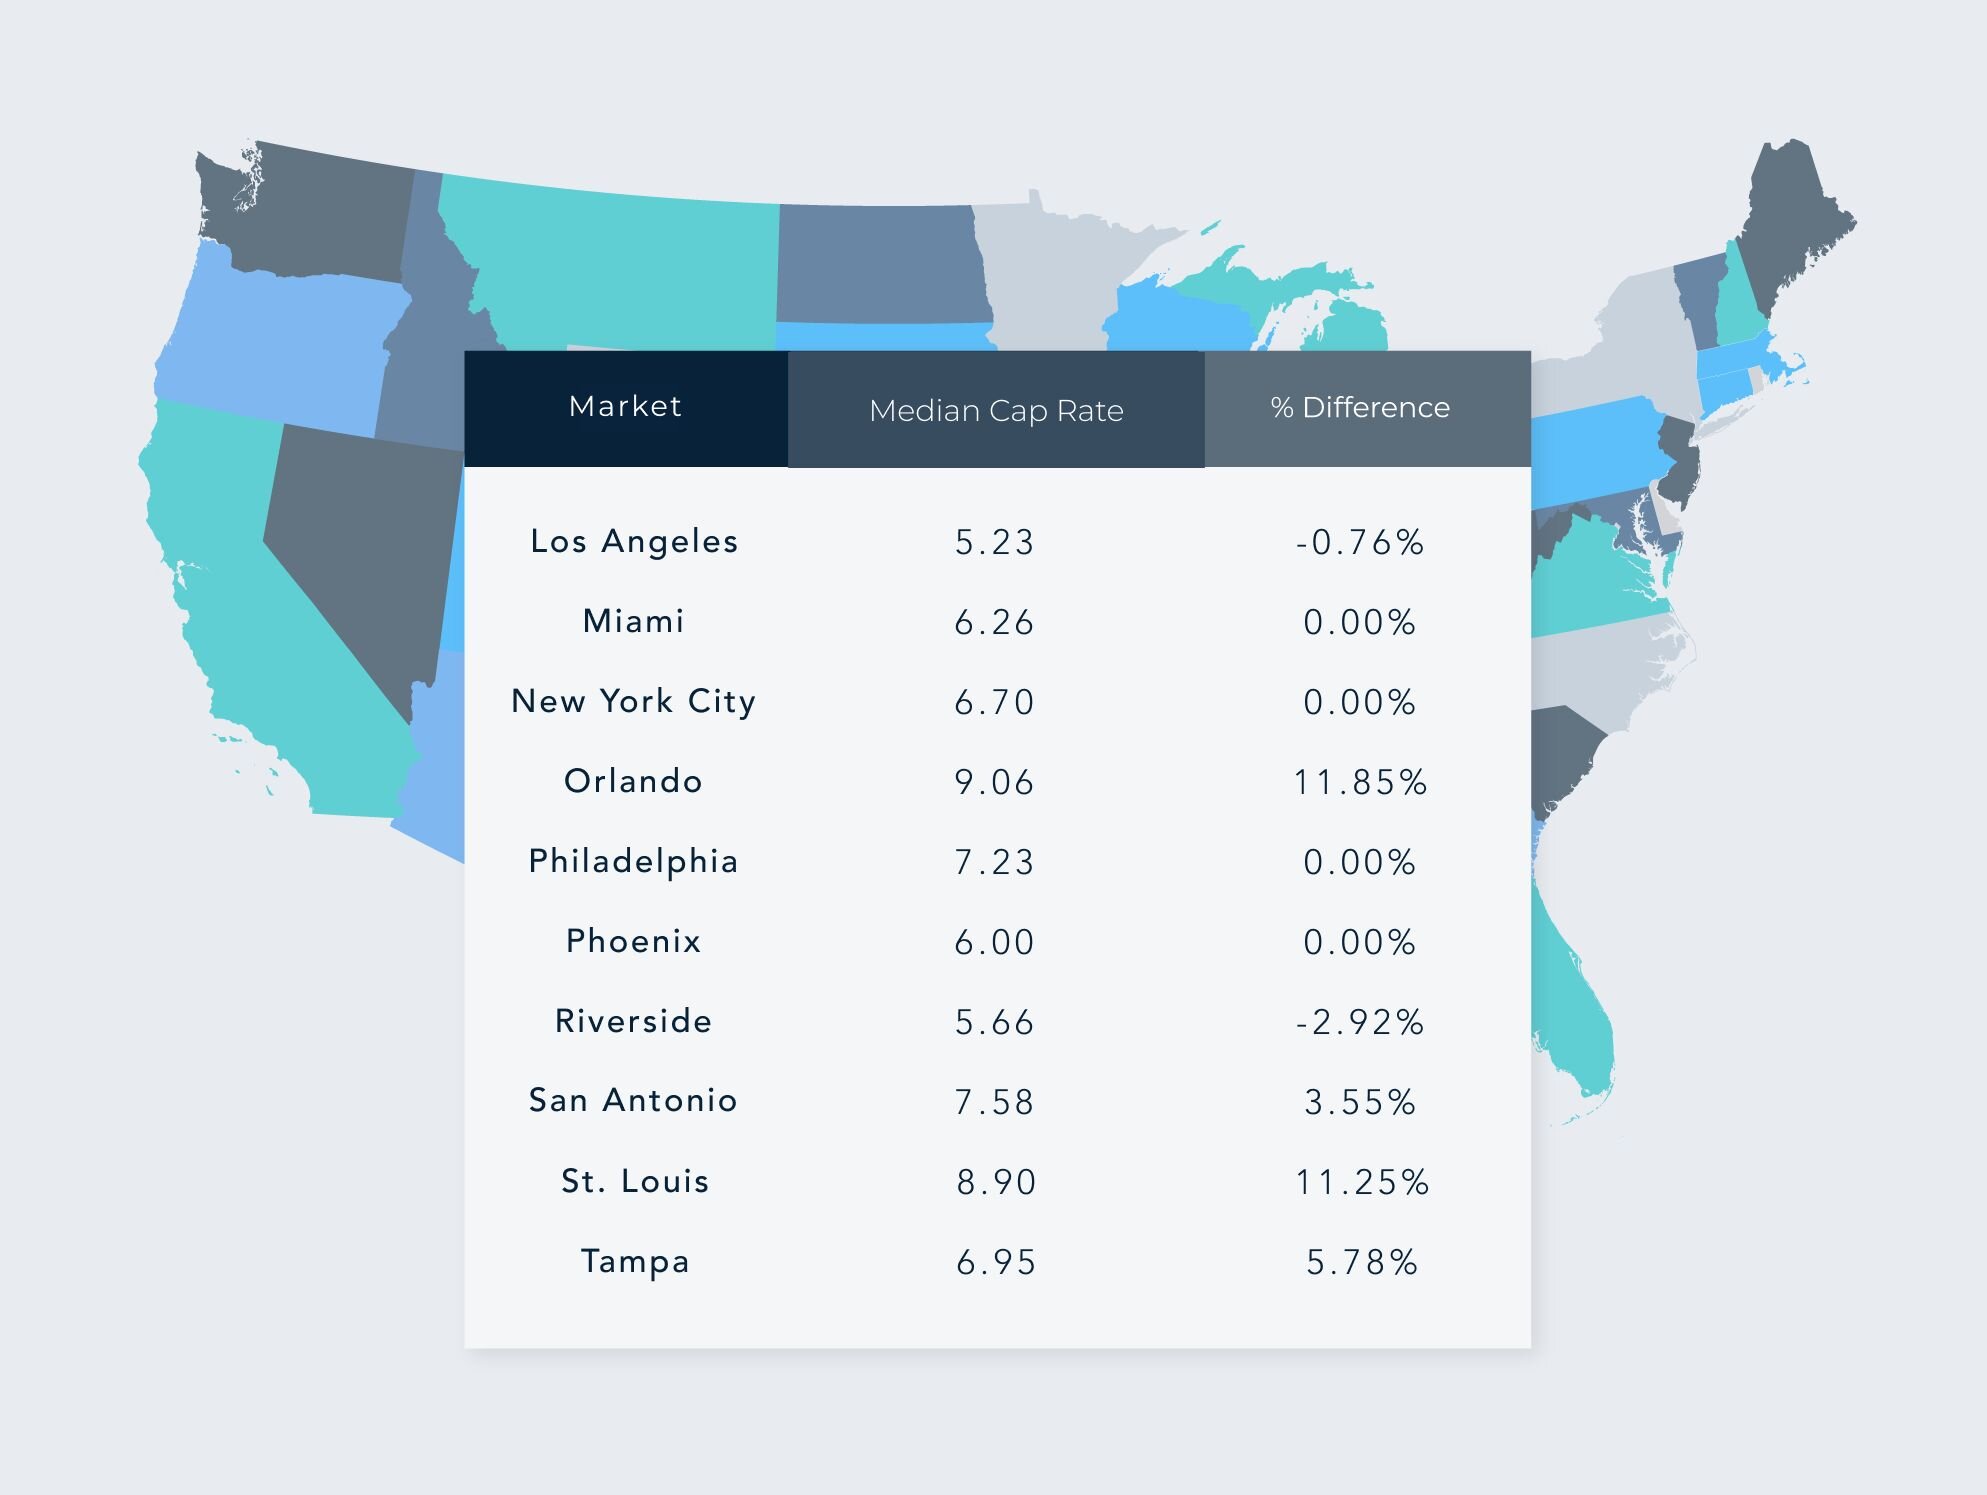
Regional Breakdown: Median Cap Rates & Changes MoM by Top MSAs – July 2025
Disclaimer: This article's information is based on Crexi's internal marketplace data and additional external sources. While asking price in many ways reflects market conditions, variations in pricing are affected by changes in inventory, asset size, etc. Nothing contained on this website is intended to be construed as investing advice. Any reference to an investment's past or potential performance should not be construed as a recommendation or guarantee towards a specific outcome.
Get more data-driven insights with Crexi Intelligence.


