Crexi National Commercial Real Estate Report: June 2025


Welcome to the June 2025 release of our Crexi Trends report. We analyze Crexi's database each month to identify relevant activity and patterns and share key insights with our users.
Our report showcases trends across Crexi's commercial property listings in June, evaluating average price per square foot, search behavior, occupancy, and other noteworthy metrics. With this information, we aim to arm commercial real estate professionals with actionable learnings to make well-informed commercial real estate decisions.
Retail
For Sale
Pricing: Retail sale prices reached $210.05 per square foot, a modest 0.67% increase from last year and a notable uptick from May’s $200.09 pricing. The sold price, when compared to the asking price per square foot of $250.16, suggests sellers continue to hold out for higher valuations than what buyers are willing to pay, even as buyers demonstrate a willingness to close at rising price points.
Cap Rates: Median sale cap rates stood at 6.60%, down a slight 1.12% from the previous year, which complement the corresponding rise in valuations we’re observing . Asking cap rates remained slightly lower at 6.50%, however, reflecting cautious but steady investor confidence in retail amid economic uncertainties.
Absorption: Retail assets had an absorption rate of 0.96% in June, down from 1.27% absorption the previous month. This dip reflects a more modest acquisition of property sales relative to new listings, and signals a cautious market with fewer completed transactions.
For Lease
Asking vs. Effective Lease Rates: The asking lease rate averaged $19.08 per square foot, while effective rates rose slightly to $19.16 per square foot. This inversion signals landlords successfully minimizing concessions amid competitive leasing conditions in high-demand locations.
Broader Trends
The retail sector in June 2025 continues to navigate economic uncertainty, intensified by recent tariff increases and shifting consumer behavior. Retail sales dropped by 0.9% in May, according to the U.S. Census Bureau, reflecting heightened consumer caution amid rising costs. Additionally, major retailers, such as Macy’s and Jo-Ann Stores, announced significant store closures, contributing to a substantial rise in retail layoffs.
Despite these headwinds, adaptive strategies continue to emerge. Mixed-use and experiential retail developments, such as the proposed $840 million Port Eastside project in East Hartford, highlight efforts to rejuvenate traditional retail spaces and align them with evolving consumer preferences. Retailers are increasingly focusing on omnichannel approaches, integrating digital and physical retail experiences to enhance resilience and respond effectively to fluctuating market conditions.
Office
For Sale
Pricing: Office sale prices climbed to $172.08 per square foot, reflecting an 8.74% year-over-year increase and continued improvement from recent months. The gap between asking ($229.13 per square foot) and sold prices remains substantial, indicating continued buyer caution regarding property valuations.
Cap Rates: Office median sale cap rates decreased to 7.05%, a notable 4.11% decline year-over-year. Asking cap rates closely tracked at 7.02%, underscoring improved market sentiment compared to earlier in the year.
Absorption: The office market reported an absorption rate of 1.09%, indicating steady but cautious transaction activity relative to new listings, reflecting moderate market optimism.
For Lease
Asking vs. Effective Lease Rates: Office lease asking rates were $19.95 per square foot, with effective rates slightly lower at $19.12. The stable gap indicates moderate landlord flexibility, particularly in suburban and secondary markets facing slower absorption.
Broader Trends
The office sector continues to face headwinds in 2025, with national vacancy rates hovering around 19.4%. The persistence of hybrid work models and corporate downsizing has led to a surplus of office space, particularly in urban cores. In response, more office space is being demolished or converted than newly constructed for the first time in 25 years, signaling a significant shift in the market.
However, there are signs of stabilization. Premium, amenity-rich office spaces in prime locations are attracting tenants seeking to entice employees back to the workplace. Furthermore, public and private stakeholders are investing in transforming underutilized office properties into residential or mixed-use developments, aiming to revitalize downtown areas and adapt to evolving urban needs, driving some of the acquisition mentioned above. As office needs stabilize, this reduction in supply will also lead to an eventual rise in valuations.
Industrial
For Sale
Pricing: Industrial property prices averaged $106.00 per square foot, marking a 7.19% increase year-over-year. The slight gap between asking ($112.17) and sold prices highlights ongoing cautiousness among buyers regarding market valuations.
Cap Rates: Sale cap rates for industrial properties rose slightly to 7.41%, with asking cap rates lower at 7.10%. This difference highlights increasing selectivity among investors and sellers amid shifting economic conditions.
Absorption: Industrial absorption stood at 0.98%, signifying a cautious pace of transactions compared to the volume of new listings, suggesting a conservative market approach.
For Lease
Asking vs. Effective Lease Rates: The asking lease rate averaged $14.14 per square foot, with effective rates notably lower at $12.30. The widened gap underscores ongoing landlord flexibility, especially in markets with recent speculative supply.
Broader Trends
The U.S. industrial real estate market continues to experience a recalibration in 2025. After years of rapid expansion driven by e-commerce and pandemic-related demands, the sector is now adjusting to a more balanced supply-demand dynamic. National vacancy rates reached their highest on Crexi in January 2025 based on data in the last five years, as supply growth has outpaced demand. This shift has led to a more tenant-favorable market, with increased availability and moderated rent growth – in response, vacancy has steadily but slowly been falling over the last six months.
Despite these challenges, the industrial sector remains resilient. Tariff uncertainties and global trade dynamics are prompting companies to reevaluate supply chains, leading to increased demand for modern, efficient facilities. Markets like San Antonio, Austin, and Dallas-Fort Worth are seeing heightened activity due to their strategic locations and infrastructure. Additionally, the push towards automation and advanced logistics is driving the development of next-generation industrial spaces, positioning the sector for sustained long-term growth.
Multifamily
For Sale
Pricing: Multifamily sale prices rose modestly to $205.27 per square foot, marking a 1.50% increase year-over-year. Comparing this sold price to the asking price per square foot ($166.24) reveals that actual sale values significantly exceeded initial seller expectations, suggesting competitive bidding for quality properties, especially as supply decreases.
Cap Rates: Multifamily median sale cap rates declined slightly to 6.36%, with asking cap rates higher at 7.15%. This widening gap indicates continued price discovery as investors navigate rising interest rates and changing market conditions.
Absorption: Absorption rates remained healthy at 1.32%, indicating consistent demand relative to the number of newly listed properties, underscoring strong ongoing interest in multifamily assets.
Broader Trends
The multifamily sector remains robust in 2025, underpinned by strong renter demand and shifting housing preferences. High mortgage rates and homeownership costs are steering more individuals towards renting, bolstering occupancy rates and tightening supply across various markets. While national rent growth is modest at 1.5%, constrained markets like New York and Kansas City are experiencing stronger gains.
A significant factor influencing the market is the decline in new multifamily construction starts, following a period of record completions. This slowdown is expected to lead to a tighter supply in the coming years, potentially accelerating rent growth from 2026 onwards. Investors are capitalizing on this trend, with $25.9 billion in multifamily transactions recorded through May 2025, indicating sustained confidence in the sector’s long-term prospects.
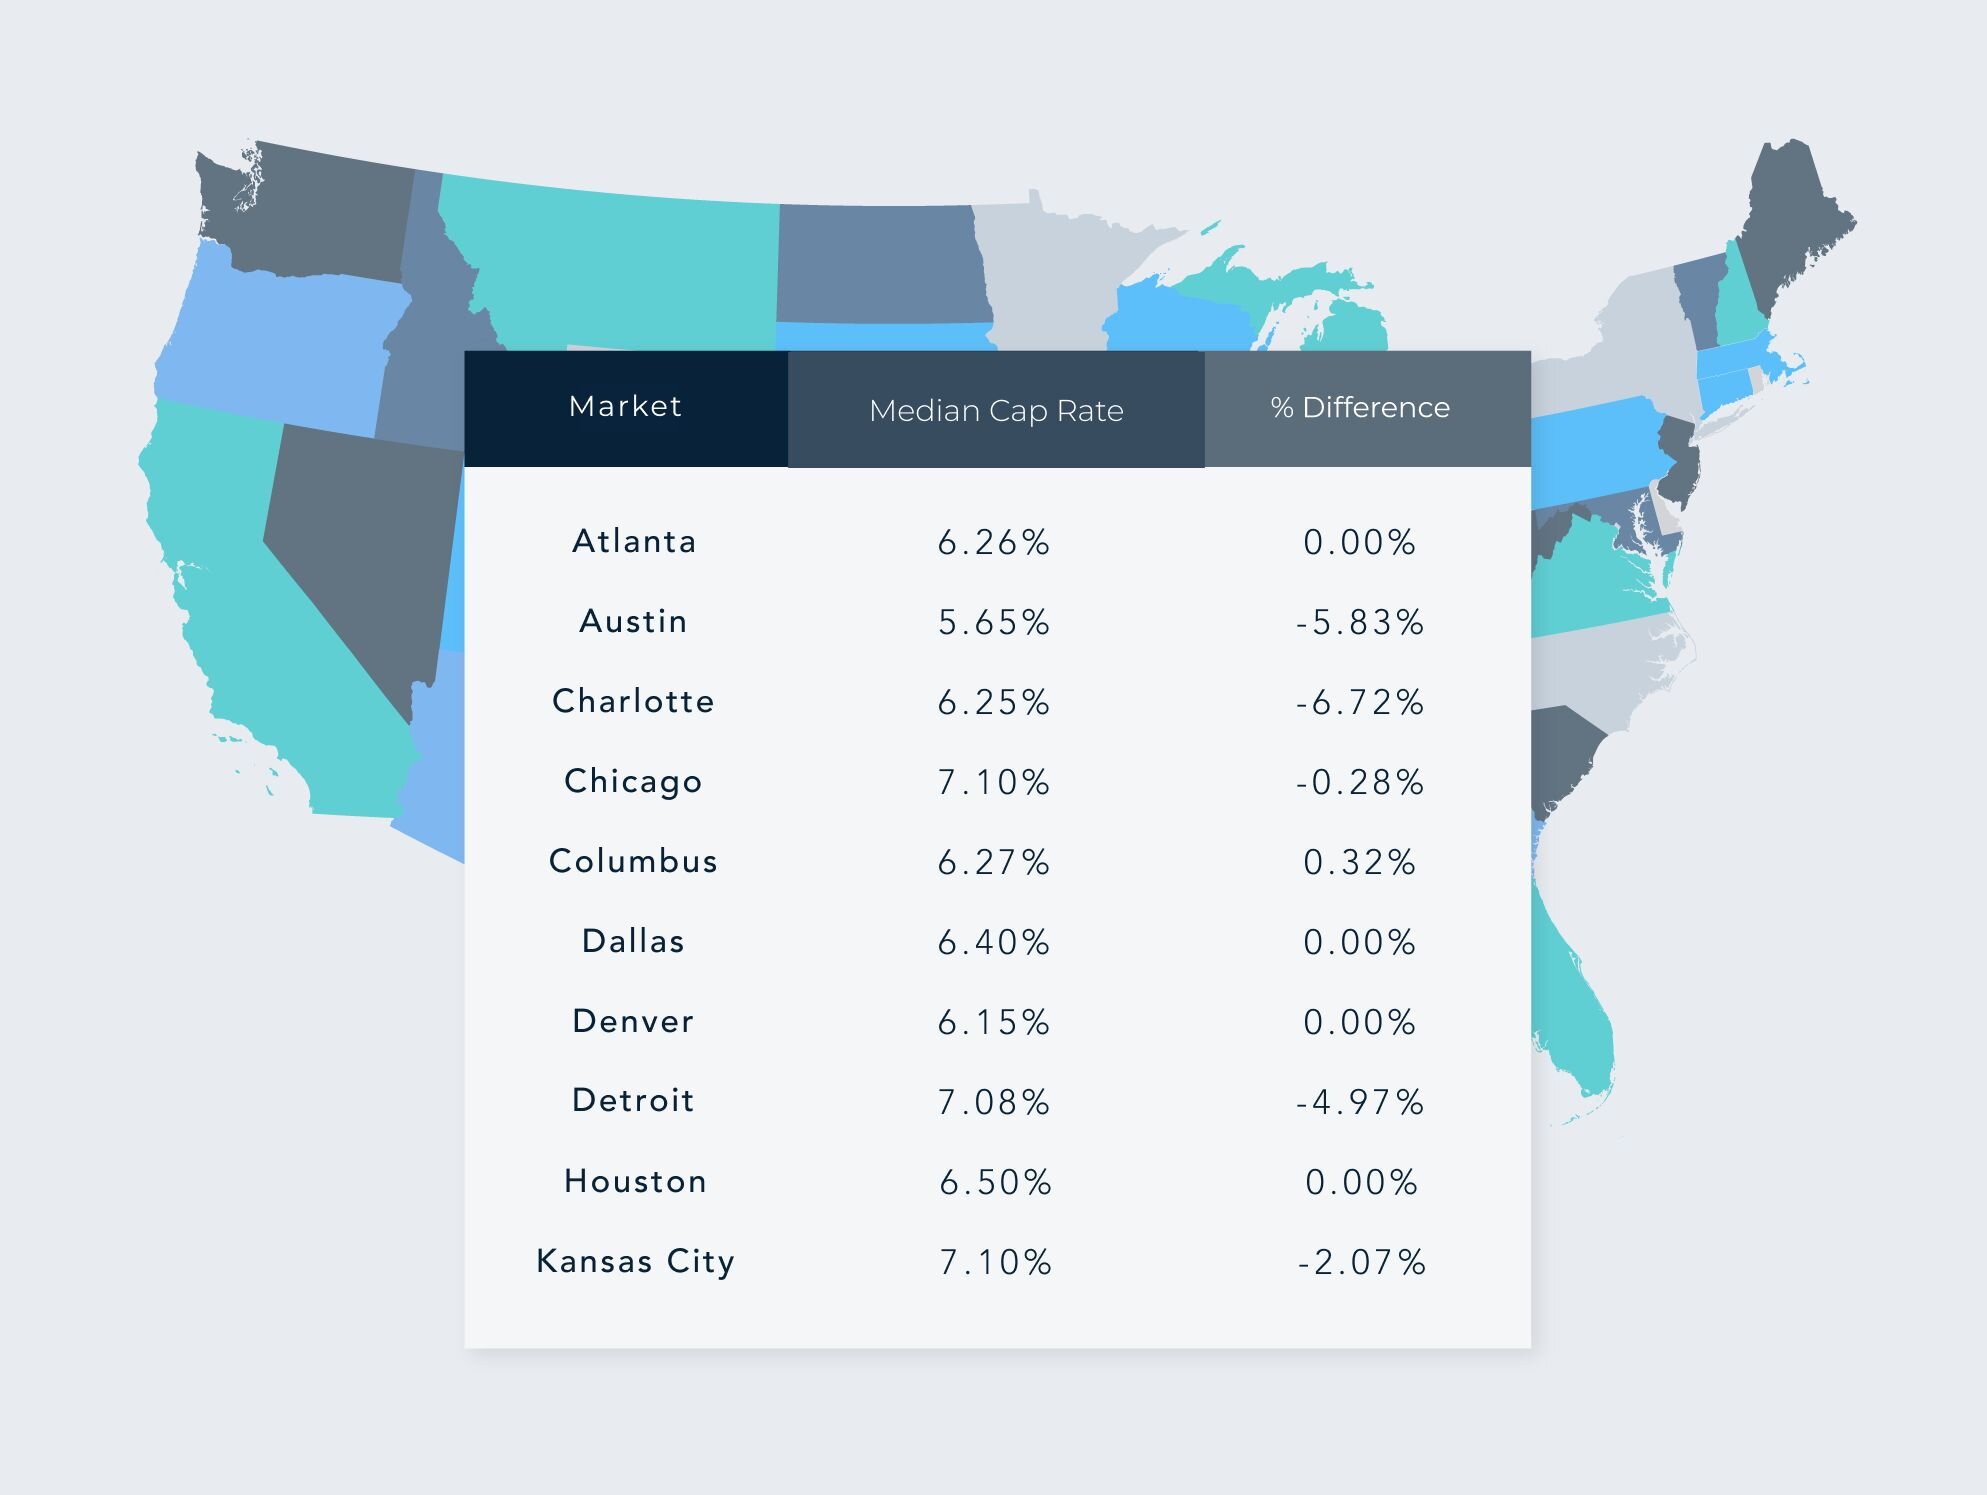
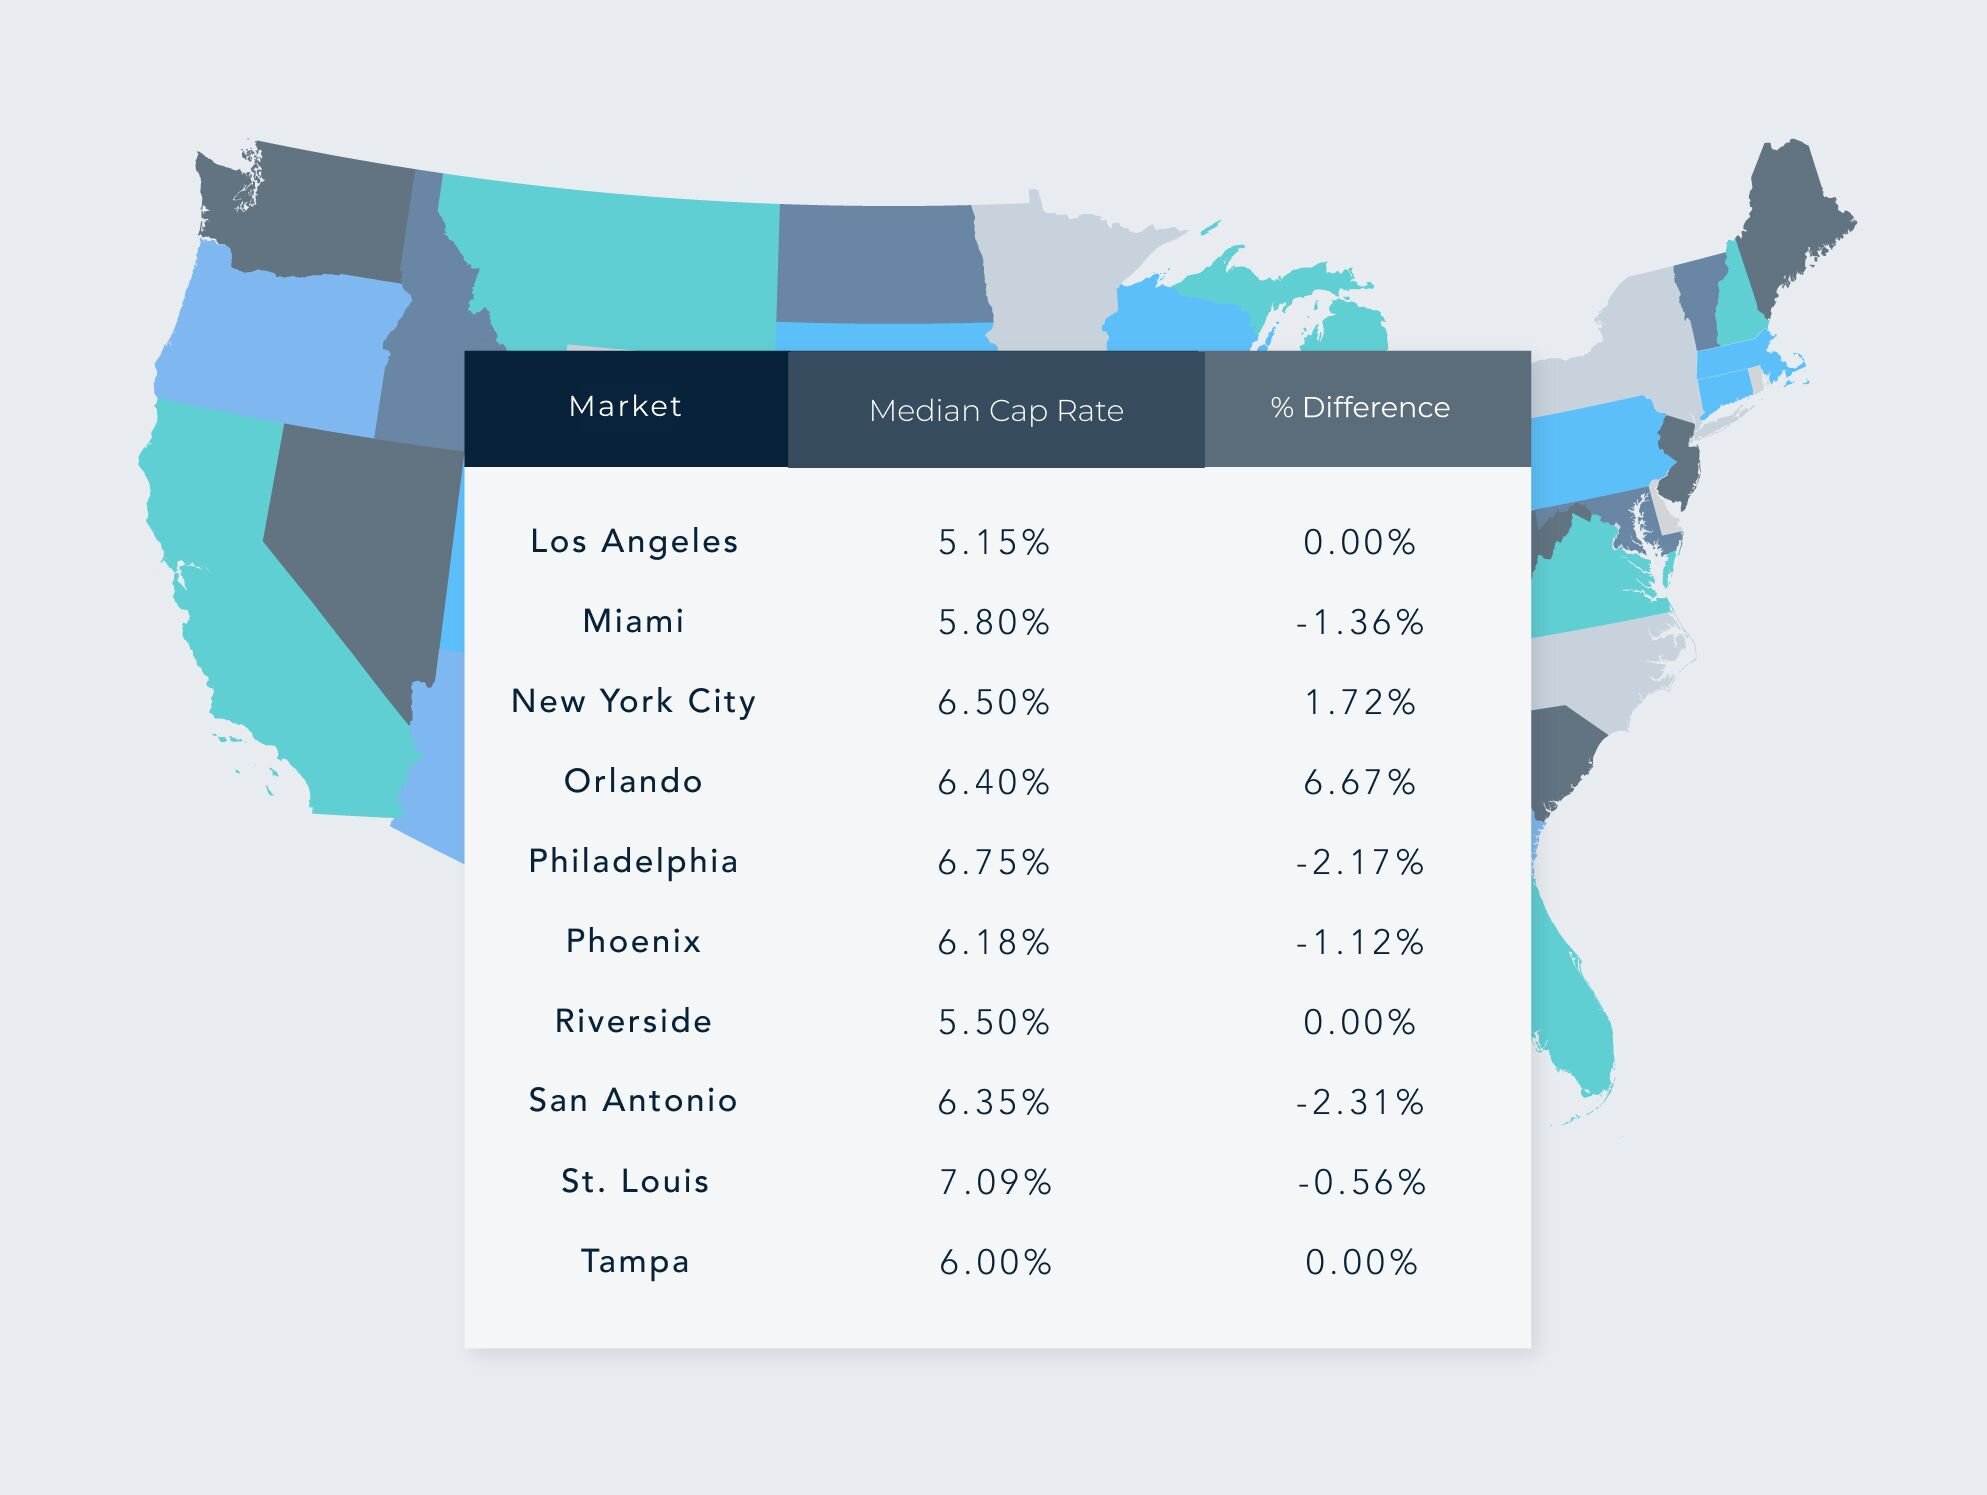
Regional Breakdown: Median Cap Rates & Changes by Top MSAs – June 2025


Disclaimer: This article's information is based on Crexi's internal marketplace data and additional external sources. While asking price in many ways reflects market conditions, variations in pricing are affected by changes in inventory, asset size, etc. Nothing contained on this website is intended to be construed as investing advice. Any reference to an investment's past or potential performance should not be construed as a recommendation or guarantee towards a specific outcome.
Get more data-driven insights with Crexi Intelligence.


