Crexi National Commercial Real Estate Report: March 2025


Welcome to the March 2025 release of our Crexi Trends report. We analyze Crexi's database each month to identify relevant activity and patterns and share key insights with our users.
Our report showcases trends across Crexi's commercial property listings in March, evaluating average price per square foot, search behavior, occupancy, and other noteworthy metrics. With this information, we aim to arm commercial real estate professionals with actionable learnings to make well-informed commercial real estate decisions.
Retail
For Sale
Pricing: In March 2025, the median sale price for retail properties on Crexi was $259.54 per square foot, reflecting a 1.69% year-over-year decrease. While slightly down, sustained investor confidence and higher absorption reflect a robust demand for retail spaces, particularly in prime locations. The steadiness in pricing is also influenced by limited new retail construction, as higher building costs have curtailed development, leading investors to compete for existing properties.
Cap Rates: The median cap rate for sold retail properties stood at 6.7%, not budging from the average of the previous month. This suggests that investors are accepting lower yields in anticipation of continued appreciation and stable income streams from retail assets. Grocery-anchored shopping centers and properties with essential service tenants remain particularly attractive, contributing to the downward pressure on cap rates.
For Lease
Asking vs. Effective Lease Rates: The median annual asking lease rate for retail spaces was $18.89 per square foot, while the effective lease rate averaged $18.41 per square foot. The narrow gap between asking and effective rates indicates strong tenant demand, allowing landlords to offer fewer concessions. This trend is especially evident in suburban markets experiencing population growth, where retailers are expanding to meet the needs of new residents.
Broader Trends
The retail sector continues to adapt to changing consumer behaviors and economic conditions. Limited availability of retail space is expected to persist throughout 2025, as the high cost of capital makes financing new projects challenging. This constraint is leading to higher asking rents and increased competition among tenants for prime locations.
Additionally, the recent implementation of tariffs by the Trump administration has introduced uncertainty into the retail market. While the full impact remains to be seen, retailers reliant on imported goods may face increased costs, potentially affecting pricing strategies and consumer demand. Some consumers are responding by stockpiling goods in anticipation of price hikes, while others are turning to secondhand markets as cost-effective alternatives. The long-term impact of these tariffs on consumer behavior and retail real estate demand remains to be seen, as the situation continues to evolve.
Office
For Sale
Pricing: The median sale price for office properties in March 2025 was $231.71 per square foot, marking a 15.6% increase compared to the same period last year. This uptick reflects renewed investor interest, particularly in Class A office spaces that offer modern amenities and are located in central business districts. The demand for high-quality office properties is driven by companies seeking to entice employees back to the office with superior work environments.
Cap Rates: Office properties recorded a median sold cap rate of 7.50%, slightly compressed from the previous month. This stability suggests that while there is growing interest in office investments, investors remain cautious due to ongoing uncertainties surrounding remote work trends and office space utilization. Properties with long-term leases and creditworthy tenants are particularly sought after, as they offer more predictable income streams.
For Lease
Asking vs. Effective Lease Rates: Asking lease rates averaged $19.95 per square foot annually, with effective rates slightly lower at $18.92 per square foot. The modest difference indicates that landlords are offering limited concessions to attract tenants, reflecting a gradually stabilizing market. However, in markets with higher vacancy rates, landlords may be more inclined to negotiate terms to secure occupancy, especially with longer lease terms.
Broader Trends
The office sector is showing signs of stabilization as more companies implement return-to-office policies. Office move-outs decreased significantly in the year ending February 2025, totaling -20.5 million square feet, as firms reinforced in-person work arrangements. Despite this positive development, the national vacancy rate rose to 14.1% due to continued negative absorption and new construction deliveries. Rent growth posted a modest gain of 0.2%, bringing the annual rate to 1.1%. While return-to-office mandates continue, it is anticipated that concrete in-person attendance policies will take time to establish, with discussions likely extending until 2027.
On the other hand, certain markets are witnessing renewed confidence. For example, law firm Goodwin Procter is relocating to a new 250,000 square-foot space at BXP’s 200 Fifth Avenue in Midtown South’s Flatiron District, signaling optimism in Manhattan’s office market. This move, set for late 2026, highlights Midtown South’s transformation, now hosting major firms like IBM and Franklin Templeton.
Manhattan’s office recovery in 2025 has outpaced other U.S. cities, with leasing volume in Q1 2024 reaching the highest levels since 2019, and availability rates at their lowest in five years—under 15% in Midtown and below 10% on Park Avenue. Attendance in office buildings has rebounded to 76% of pre-pandemic levels. Leading firms such as Citadel, Blackstone, Amazon, and Alphabet are increasing their New York space, indicating a selective yet positive trend in certain urban office markets.
Industrial
For Sale
Pricing: Industrial properties saw a median sale price of $110.67 per square foot in March 2025, representing a 1.4% year-over-year decrease. This stability despite economic uncertainty underscores the continued strong demand for industrial assets, driven by the expansion of e-commerce and the need for efficient distribution networks. Investors are particularly interested in properties located near major transportation hubs and urban centers to facilitate last-mile delivery.
Cap Rates: The median cap rate for sold industrial properties was 7.27%, reflecting a climb of 18 basis points from the previous month. This trend indicates sustained investor confidence in the industrial sector, with expectations of continued rental growth and low vacancy rates. Properties with modern facilities and strategic locations are commanding premium valuations.
For Lease
Asking vs. Effective Lease Rates: The median annual asking lease rate was $13.80 per square foot, while the effective rate averaged $12.45 per square foot. The relatively small gap suggests a landlord-favorable market, with strong tenant demand allowing for minimal concessions. High-quality industrial spaces, especially those equipped for logistics automation and cold storage, are achieving top-of-market rates in key distribution hubs such as the Inland Empire, Dallas–Fort Worth, and Atlanta.
Broader Trends
The industrial sector remains a resilient asset class across U.S. commercial real estate, supported by robust demand from e-commerce, third-party logistics (3PL), and manufacturing users. While construction starts have slowed due to increased borrowing costs, demand for modern logistics space continues to outpace supply in many markets. National absorption remains positive, and availability is tightening in infill locations, helping to push lease rates higher and sustain pricing strength.
Another key factor to watch is the global trade environment, which is shifting under new economic policies. The Trump administration’s early 2025 tariffs on a broad range of imported goods—especially a 125% tariff on Chinese goods—have disrupted supply chains and prompted more companies to localize operations. While this creates near-term uncertainty for some tenants, the long-term implications could benefit U.S. industrial real estate as manufacturers reshore production and establish new domestic warehousing strategies. As more firms reassess their global logistics models, demand for well-located industrial real estate is expected to remain steady.
Multifamily
For Sale
Pricing: In March 2025, the median sale price for multifamily properties on Crexi was $163.09 per square foot, showing a slight 2.5% decline from the previous year. This dip in pricing reflects a recalibration in the market as cap rates expand and debt financing becomes more expensive. Investors are becoming more selective, often targeting properties with operational upside or those located in high-growth secondary markets where affordability and job growth remain strong.
Cap Rates: The median cap rate for sold multifamily assets was 6.54%, while asking cap rates hovered slightly higher at 7.11%. This spread suggests a disconnect between buyer and seller expectations, with the market gradually adjusting to a higher cost of capital environment. Stabilized assets with strong rent rolls remain attractive, but value-add deals are commanding increased scrutiny from investors wary of interest rate volatility and rent growth deceleration.
Absorption: Multifamily absorption on Crexi posted a healthy 1.62% rate in March 2025. This positive performance aligns with sustained demand for rental housing, driven by demographic trends, lifestyle preferences, and barriers to homeownership. Renters continue to favor well-located properties with strong amenities and proximity to employment centers, supporting leasing velocity across much of the U.S.
Broader Trends
The multifamily market remains a preferred asset class for many investors, but headwinds have emerged in the form of elevated construction deliveries, regulatory uncertainty, and tighter capital markets. Markets that experienced outsized rent growth during the pandemic era, such as Phoenix and Austin, are seeing a normalization in rents as supply catches up to demand. Meanwhile, Class A urban assets are rebounding, fueled by younger renters returning to city centers and employers reinforcing return-to-office mandates.
Another dynamic shaping the sector is the growing affordability gap in housing. With interest rates keeping mortgage payments out of reach for many would-be buyers, demand for rentals remains elevated—especially in workforce and affordable housing segments. Investors are taking note, with increased capital targeting Class B and C multifamily properties that can serve middle-income renters. Rent control discussions are also gaining attention in some states, adding complexity to underwriting in certain urban markets. Overall, while pricing has softened, long-term fundamentals for multifamily housing remain compelling.
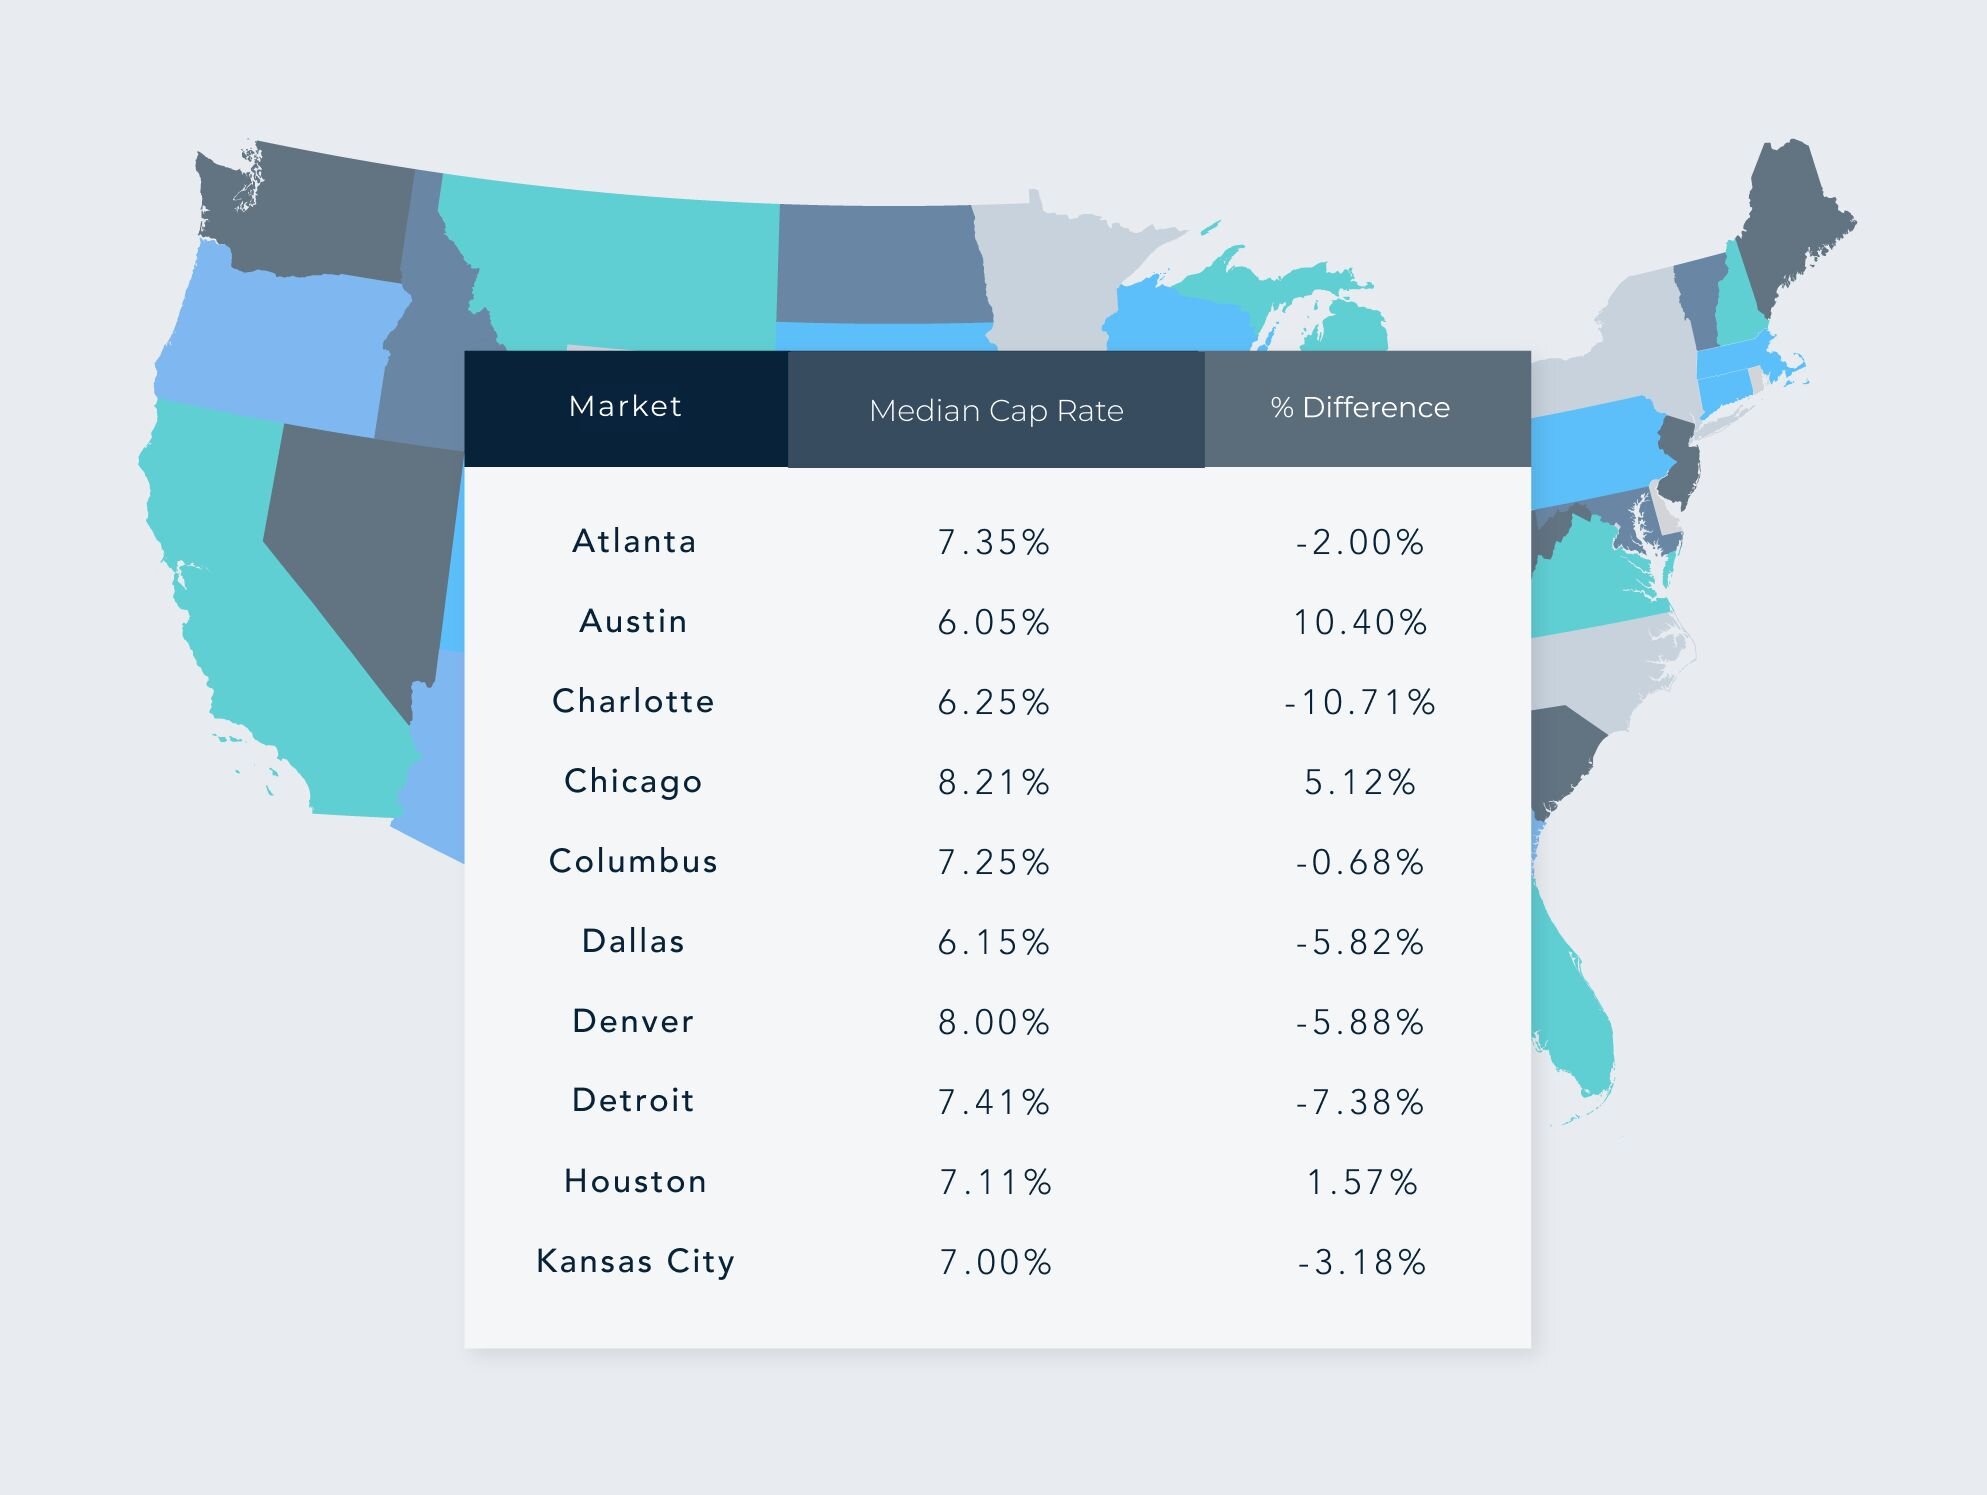
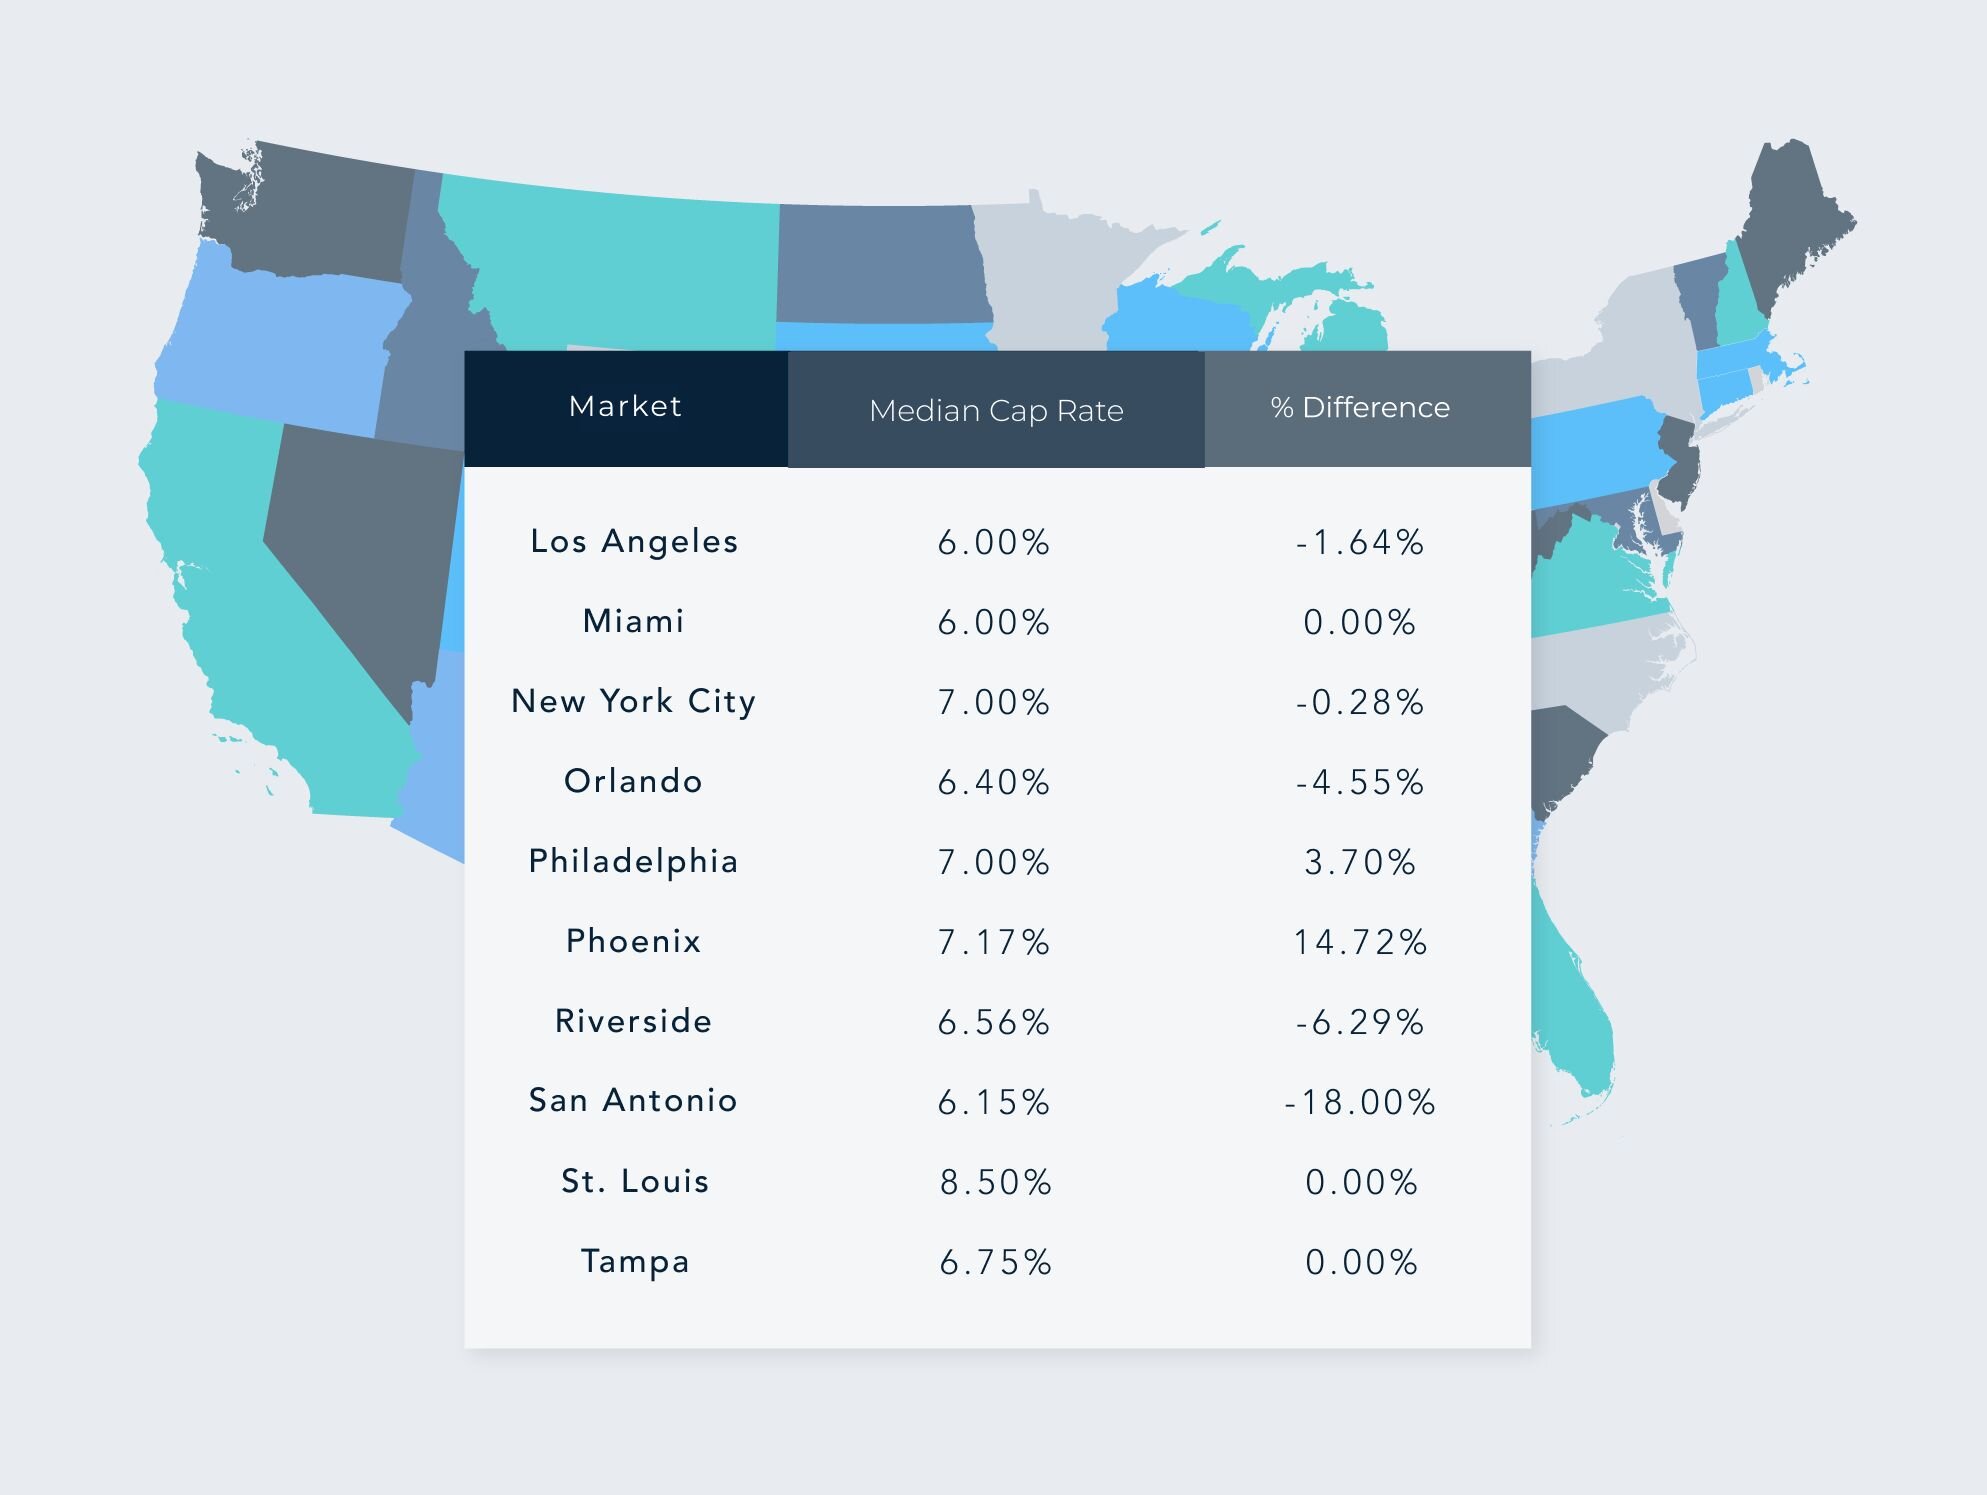
Regional Breakdown: Median Cap Rates & Changes by Top MSAs – March 2025


Disclaimer: This article's information is based on Crexi's internal marketplace data and additional external sources. While asking price in many ways reflects market conditions, variations in pricing are affected by changes in inventory, asset size, etc. Nothing contained on this website is intended to be construed as investing advice. Any reference to an investment's past or potential performance should not be construed as a recommendation or guarantee towards a specific outcome.
Get more data-driven insights with Crexi Intelligence.


