Crexi National Commercial Real Estate Report: May 2025


Welcome to the May 2025 release of our Crexi Trends report. We analyze Crexi's database each month to identify relevant activity and patterns and share key insights with our users.
Our report showcases trends across Crexi's commercial property listings in May, evaluating average price per square foot, search behavior, occupancy, and other noteworthy metrics. With this information, we aim to arm commercial real estate professionals with actionable learnings to make well-informed commercial real estate decisions.
Retail
For Sale
Pricing: Retail properties recorded a median sale price of $199.94 per square foot in May 2025, a 2.29% decline year-over-year. This slight decline reflects growing investor caution due to increased economic uncertainty and tariff-related pressures, contrasting with previously steady growth and retail’s standout status as resilient last year. However, prime locations with strong tenant profiles continue to command competitive pricing.
Cap Rates: The median sale cap rate for retail was 6.60% in May, closely aligned with the asking cap rate of 6.50%. The narrow spread underscores continued buyer-seller alignment, particularly for essential-service and grocery-anchored assets, which remain favored by investors for their resilience. However, asking rates have gradually risen over the last six months amid economic uncertainty, particularly for import-reliant retail businesses.
For Lease
Asking vs. Effective Lease Rates: Asking lease rates averaged $19.17 per square foot annually, with effective rates slightly lower at $18.82 per square foot. This modest gap highlights persistent leasing demand, tempered by selective tenant incentives to secure longer lease terms or high-credit tenants.
Absorption: Retail assets had an absorption rate of 1.16%, a moderate slowdown from previous months, suggesting tenants may be reconsidering expansion or relocation plans amid economic uncertainty.
Broader Trends
Retail continues to navigate the whiplash from the Trump administration's tariffs proposed (and delayed) since April 2025. While larger retailers adjust sourcing strategies to mitigate increased costs, smaller retailers face heightened pressures, potentially leading to renegotiations or shifts toward more flexible lease terms. Retail landlords remain cautious, balancing tenant stability with proactive leasing strategies to manage potential vacancy risks, as highlighted by CFO Dive’s recent analysis on tariff-related pauses in retail and industrial deals.
Additionally, sectors such as the toy and apparel industries, heavily reliant on Chinese imports, are experiencing significant disruptions and rising costs. These challenges are prompting shifts in both inventory management and supply chain strategies, potentially reshaping retail footprints and real estate needs going forward. But while stockpiling may mitigate pain from tariffs coming online, it won’t be a permanent solution.
Office
For Sale
Pricing: Office properties saw a median sale price of $167.06 per square foot, representing an 8.81% annual increase, signaling ongoing investor confidence in higher-quality office assets. Compared to earlier in the year, growth remains steady despite broader economic volatility, but the sector continues to slowly recover from the low points of previous years. Class A offices in central business districts particularly drove this pricing surge.
Cap Rates: The median sale cap rate was 7.16%, while asking cap rates were slightly lower at 7.02%. However, sale cap rates have continued on a six-month downward slide after hitting a 7.65% peak in November 2024, pointing to returning confidence in the office sector.
For Lease
Asking vs. Effective Lease Rates: Office lease rates showed an asking price of $19.97 per square foot annually in May, with effective rates averaging $18.50 per square foot. The widening gap reflects landlords’ increased efforts to attract tenants by offering more substantial incentives, particularly in suburban and secondary markets where demand remains uneven.
Broader Trends
Office market dynamics are gradually stabilizing, with selective recovery seen in core urban areas. Despite high national vacancy levels, companies committed to hybrid work models continue seeking smaller, higher-quality spaces. Meanwhile, secondary markets face ongoing challenges due to the slower return-to-office pace, prompting landlords to offer more generous concessions. However, investor scrutiny is increasing as trade uncertainties persist, highlighting the cautious optimism among stakeholders.
Emerging office market strategies include flexible leasing options, increased amenities, and hybrid-friendly configurations. Investors and landlords are prioritizing assets that offer versatile spaces and can quickly adapt to shifting tenant preferences and evolving economic conditions.
Industrial
For Sale
Pricing: Industrial properties reached a median sale price of $104.40 per square foot, reflecting a year-over-year increase of 7.29%, demonstrating persistent demand driven by robust logistics and e-commerce sectors, though growth has moderated slightly from earlier peaks as operators pause expansion plans amidst tariff-related uncertainty.
Cap Rates: Median sale cap rates stood at 7.27%, slightly higher than asking cap rates at 7.17%, pointing toward cautious optimism in pricing and buyer interest. Investors remain selective, prioritizing strategically located and well-leased properties.
For Lease
Asking vs. Effective Lease Rates: Industrial asking lease rates averaged $14.10 per square foot, while effective rates were notably lower at $12.05 per square foot. This widening gap compared to previous periods reflects landlords’ increased negotiation flexibility, driven by tenant cost sensitivity and a moderate uptick in speculative supply.
Absorption: Industrial absorption was stable at 1.11%, slightly lower than previous months, highlighting steady but cautious tenant activity amidst economic volatility.
Broader Trends
The industrial sector still faces pressures from rising construction costs and uncertainties related to tariffs. However, reshoring activities and the need for supply chain resilience continue to sustain strong fundamentals. Markets near major logistics hubs and transportation corridors remain particularly competitive, maintaining steady leasing activity and investor interest.
Companies are increasingly shifting their logistics strategies to mitigate tariff impacts and enhance supply chain efficiency. As a result, secondary industrial markets are seeing increased attention due to their cost advantages and logistical benefits, a trend expected to sustain industrial sector stability despite broader economic volatility.
Multifamily
For Sale
Pricing: Multifamily sale prices rose slightly to $201.93 per square foot, nearly flat compared to the previous year. Despite only modest year-over-year changes, consistent demand for stable, income-producing assets continues to drive investor interest.
Cap Rates: The median sale cap rate was 6.45%, significantly lower than the asking cap rate of 7.13%, suggesting cautious buyer optimism and selective price adjustments due to evolving market conditions. Sold cap rates have climbed up from 6.22% low in November 2024, indicating a growing risk in investment aligned with general market uncertainty.
Absorption: Absorption rates remained strong at 1.44%, reinforcing consistent demand driven by demographic shifts and homeownership barriers, particularly among younger households.
Broader Trends
Multifamily markets remain resilient, with investors favoring affordable and workforce housing amid rising affordability concerns in single-family markets. High-growth cities continue experiencing elevated vacancies due to new supply peaks, but underlying demand fundamentals are intact. Institutional investors are increasingly targeting stable secondary and tertiary markets offering steady occupancy and moderate rent growth, adjusting strategies to manage short-term economic uncertainty.
Furthermore, multifamily investors are placing greater emphasis on operational efficiencies and value-add strategies to navigate increased financing costs and market volatility. This strategic pivot supports continued investment activity and robust deal flow across various markets.
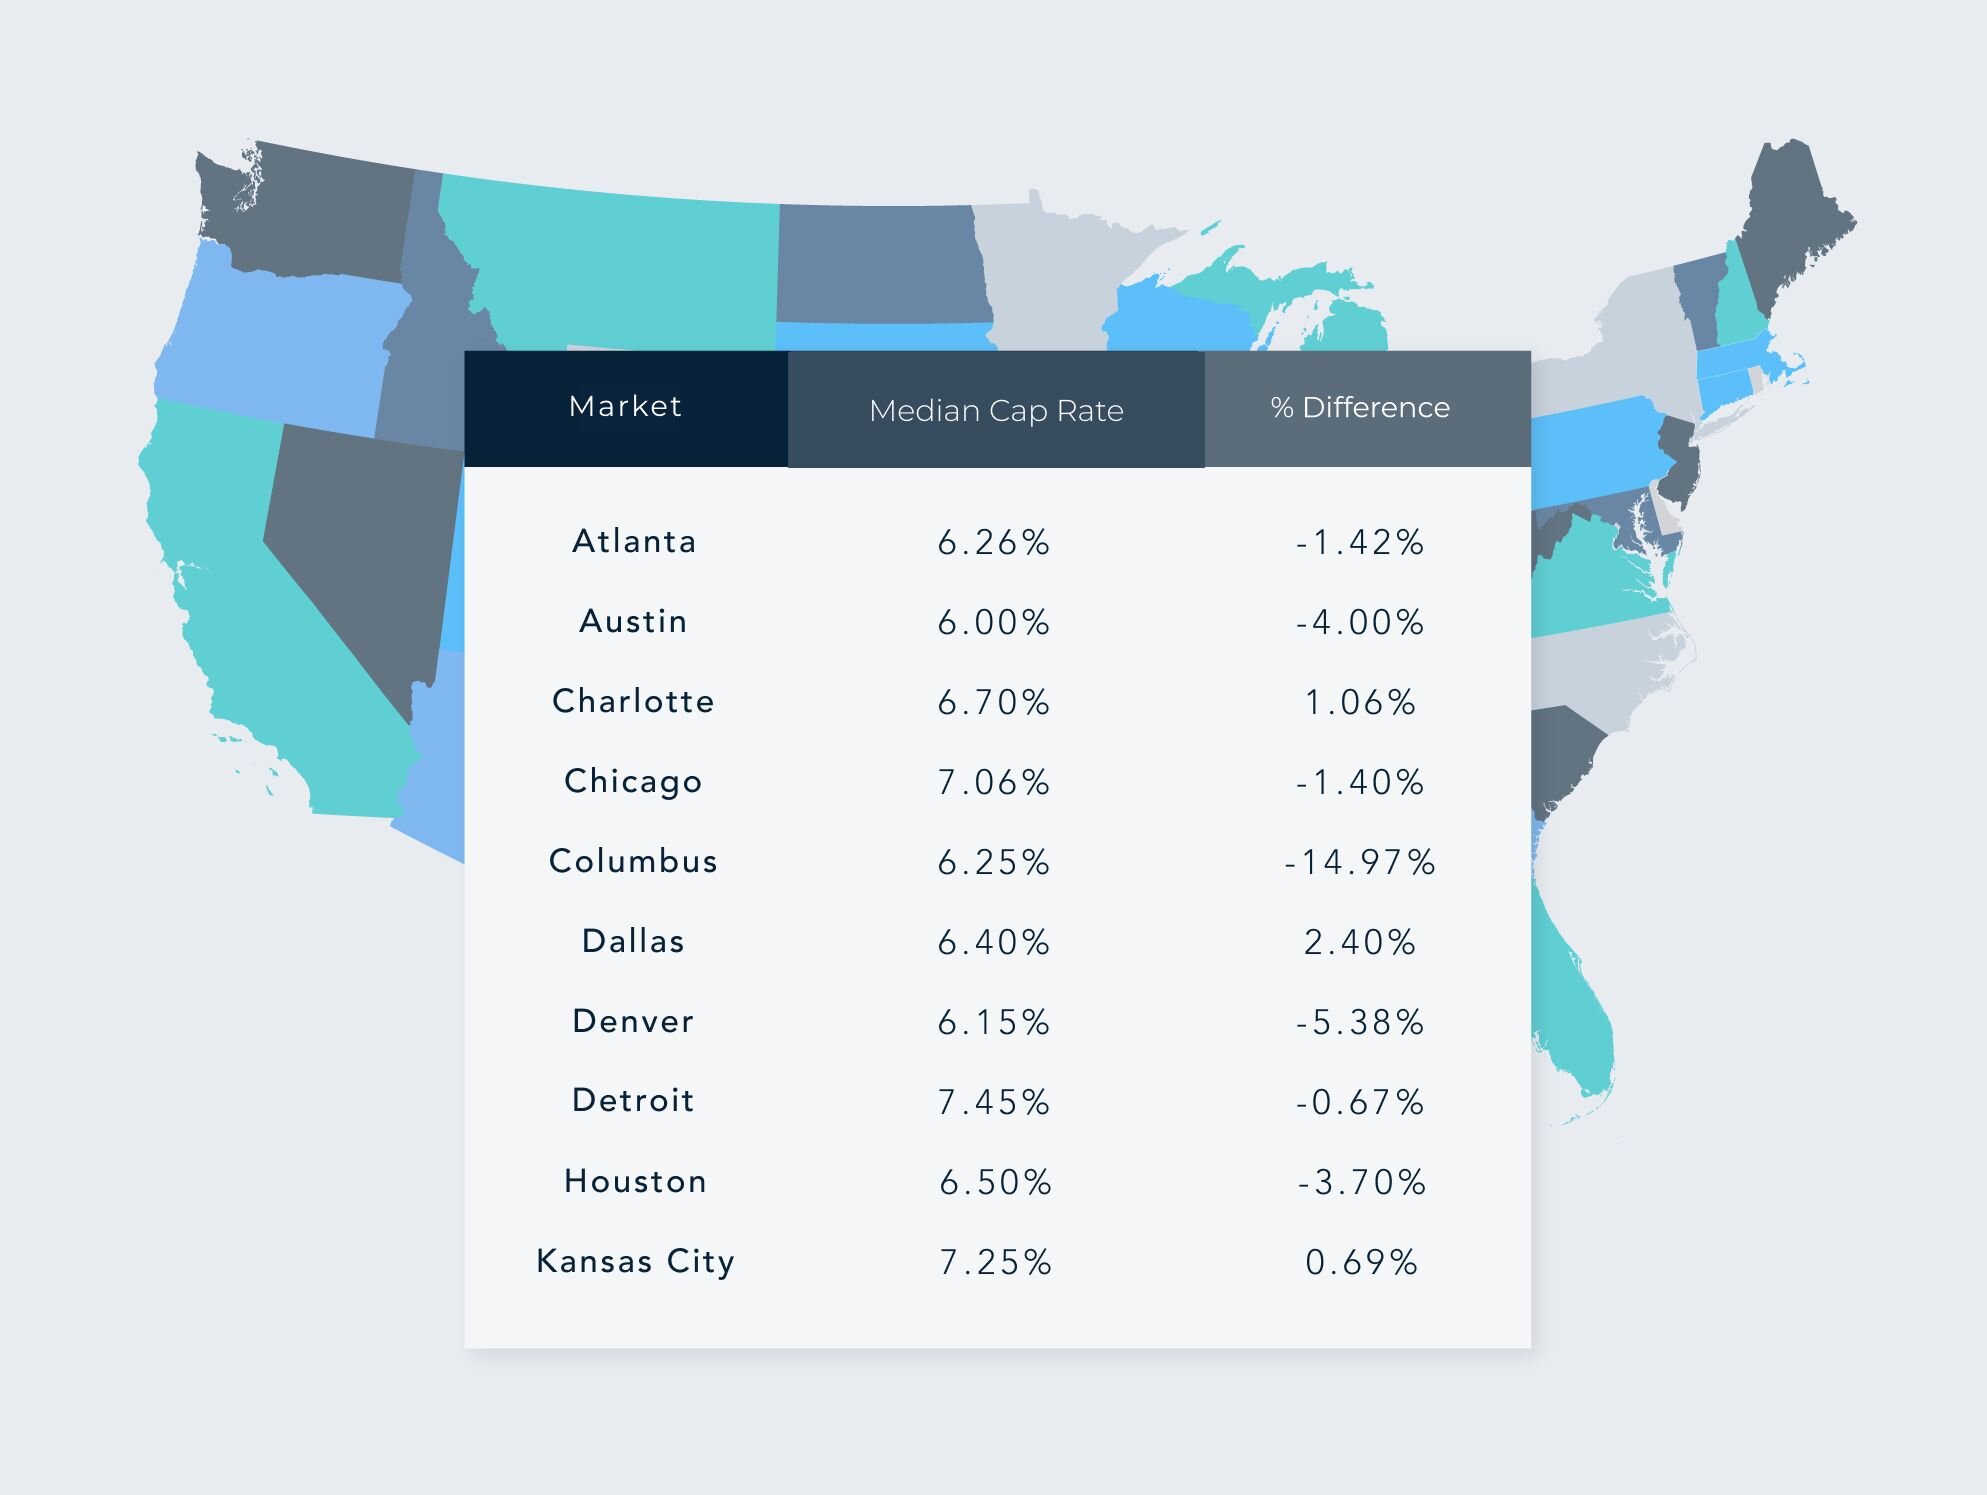
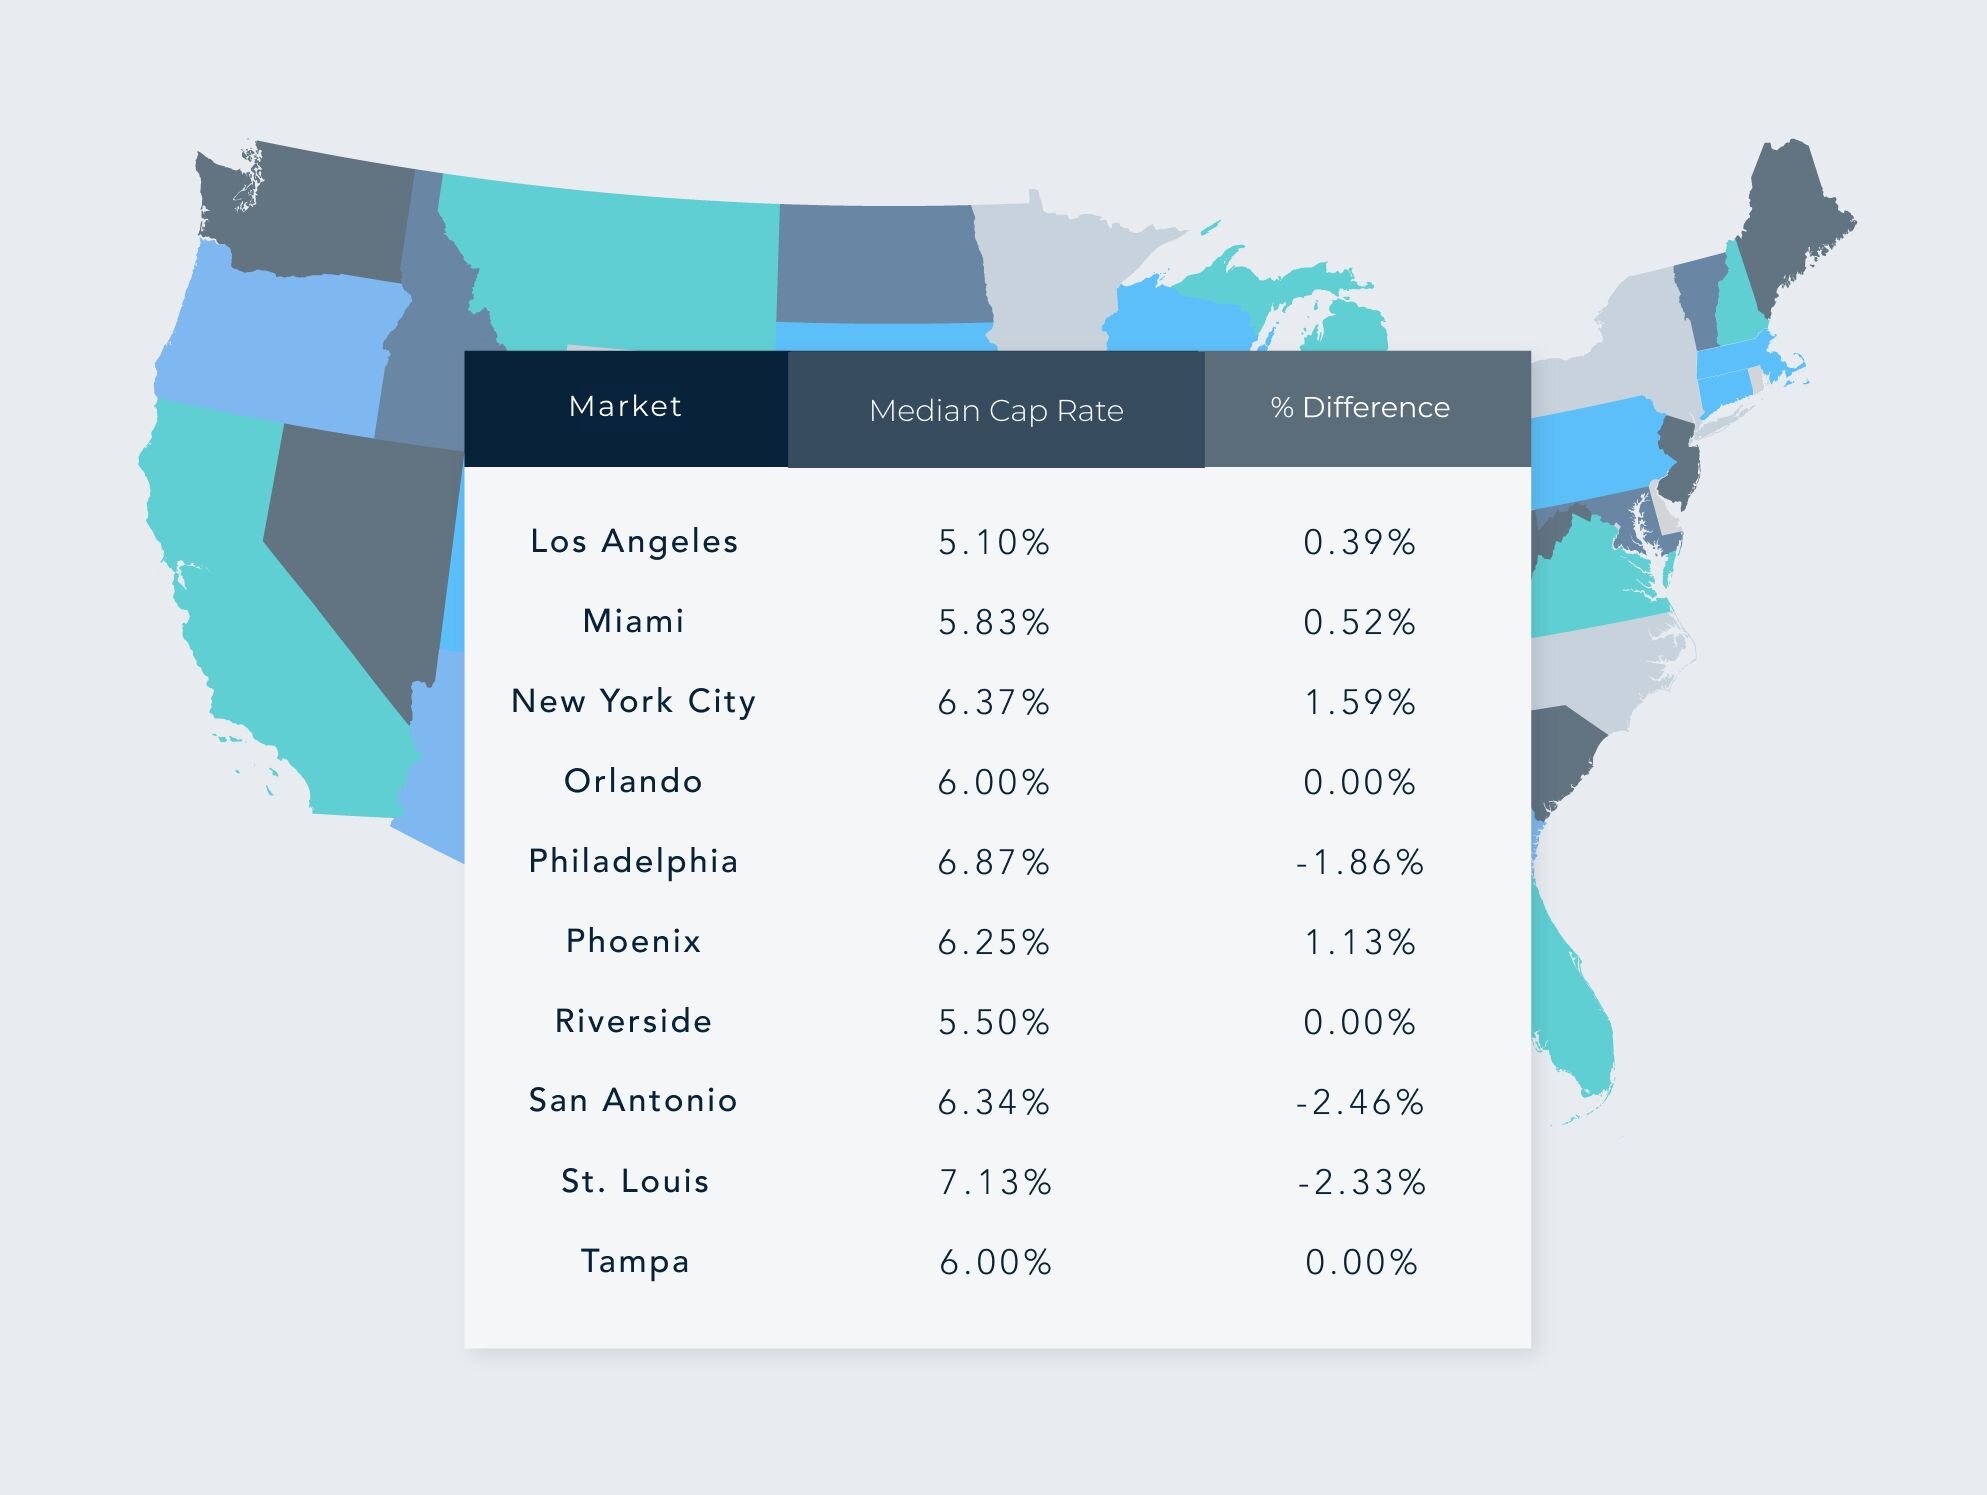
Regional Breakdown: Median Cap Rates & Changes by Top MSAs – May 2025


Disclaimer: This article's information is based on Crexi's internal marketplace data and additional external sources. While asking price in many ways reflects market conditions, variations in pricing are affected by changes in inventory, asset size, etc. Nothing contained on this website is intended to be construed as investing advice. Any reference to an investment's past or potential performance should not be construed as a recommendation or guarantee towards a specific outcome.
Get more data-driven insights with Crexi Intelligence.


