Crexi’s Newest Due Diligence Feature: Map Overlays
Category: Product
Due diligence and research are two of the most critical components in any commercial property deal-making process. Investors and brokers alike utilize market data and analytics to inform their investment decisions and identify properties for their needs. Crexi’s Map Overlays were designed to instantly provide property-seekers accurate and up-to-date, valuable information about any market of interest.
In this article, we dive into valuable ways to employ Map Overlays in property searches, including how you can use the feature to maximize market knowledge and make informed investing decisions.
Getting Started with Map Overlays
To kick things off, perform a search on Crexi and click the “Overlays” button to select the overlay that you want displayed directly on the map.
Different types of Map Overlays
Population count (free)
In this mode, view population count based on the latest census, separated by block group, tract, zip code, county, or state, depending on your zoom level. Click within the outline to get exact counts.
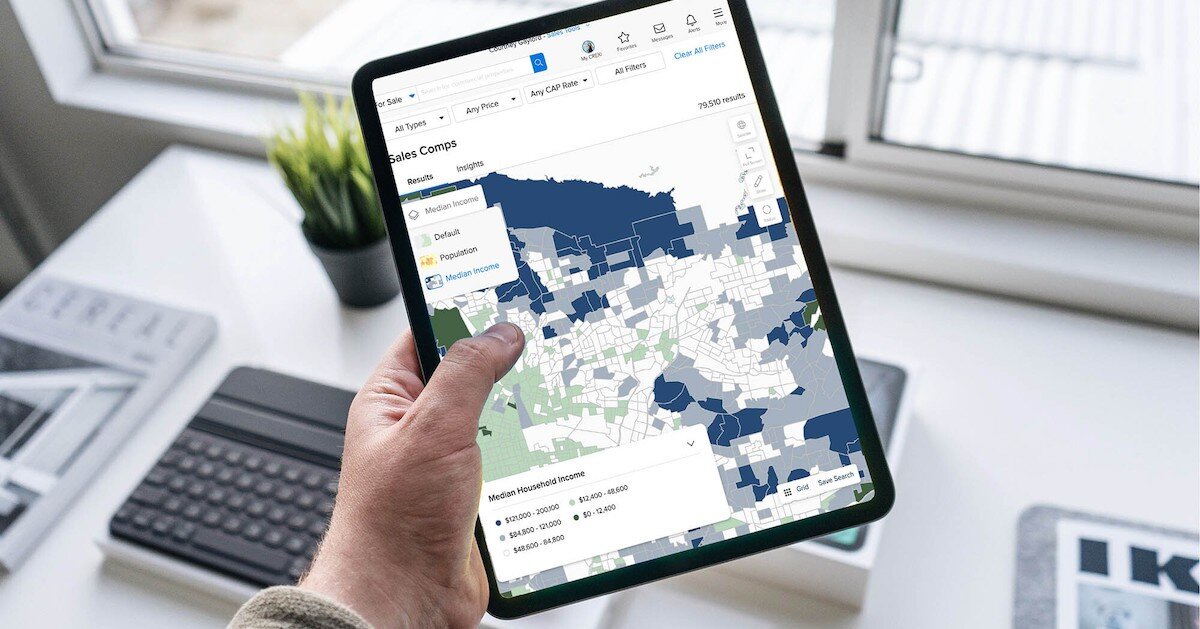
Median income
This map overlay allows you to view median income levels, separated by block group, tract, zip code, county, or state, depending on your zoom level. Click within the outline to get the exact median income.
Traffic count
This view shows the number of vehicles that pass by per day. Click on green, yellow, or red circles displayed on the map to see different traffic levels in a given area.
Points of interest
Points of interest allow you to browse a map view that includes restaurants, gas stations, airports, schools, and banks, displaying additional information provided by Google.
Why You Should Use Map Overlays
The Map Overlays feature was designed to give Crexi users in-depth information about a given area or commercial property. With different data points such as population count, median income levels, traffic count, and nearby points of interest, Map Overlays allows users to make more informed investing and valuation decisions.
How to Get the Most Out of Map Overlays Market Data
We’ve interviewed some of our users to learn how investors and tenants use Map Overlays to conduct their day-to-day business. Below, we showcase three different use cases for how users can replicate these strategies in their own investment decisions. Follow our step-by-step guides to understand the full benefits of Map Overlays.
Find a high-traffic retail space
Visibility is of utmost importance when looking for a new retail space. Display the exact number of vehicles per day (VPD) passing by a property using the traffic count overlay.
- Search for retail spaces here: https://www.crexi.com/lease/properties/Retail
- Enter the location you’re exploring
- Click the “Show Map” toggle at the top right of the search results page
- Click the “Overlays” button and select “Traffic Count”
- Select green, yellow, or red circles to see the exact number of vehicles per day in that location
Due diligence for multifamily investments
If you’re interested in investing in a multifamily property, population and median income levels are always included in the due diligence process. Strong population growth and rent-to-income ratios are easy to calculate using the population and median income overlays.
Population growth trends are also seen in the insights tool for all search results and listings. The latest census data provides this information.
- Search for multifamily properties here.
- Enter the location you’re currently exploring
- Click the “Show Map” toggle at the top right
- Click the “Overlays” button and select “Population” or “Median Income”
- Select the tract or zip code (depending on your zoom level) to display exact population count or median income amount
- For trending data, view the “Insights” tool on any search or listing
Another helpful tip for this example: see Points of Interest tab to explore nearby schools.
Discover amazing restaurants close to your next office space
As COVID-19 cases drop and businesses across the country continue to transition employees from fully remote to hybrid or in-office, we’ve seen our office space inventory rise significantly, as noted in Crexi’s National CRE Report from June 2021. Good food is good for business. Easily view all of the restaurants near your potential office with the points of interest overlay.
- Search for offices here
- Enter the location you’re exploring
- Click the “Show Map” toggle at the top right
- Click the “Overlays” button and select “Points Of Interest”
- Select “Restaurants” and you’ll see restaurants located wherever you’re searching
We hope this article helps you understand the valuable data immediately available at your fingertips using Map Overlays. Curious about how to access this data? Learn more about Intelligence here.