The Phoenix Commercial Real Estate Market

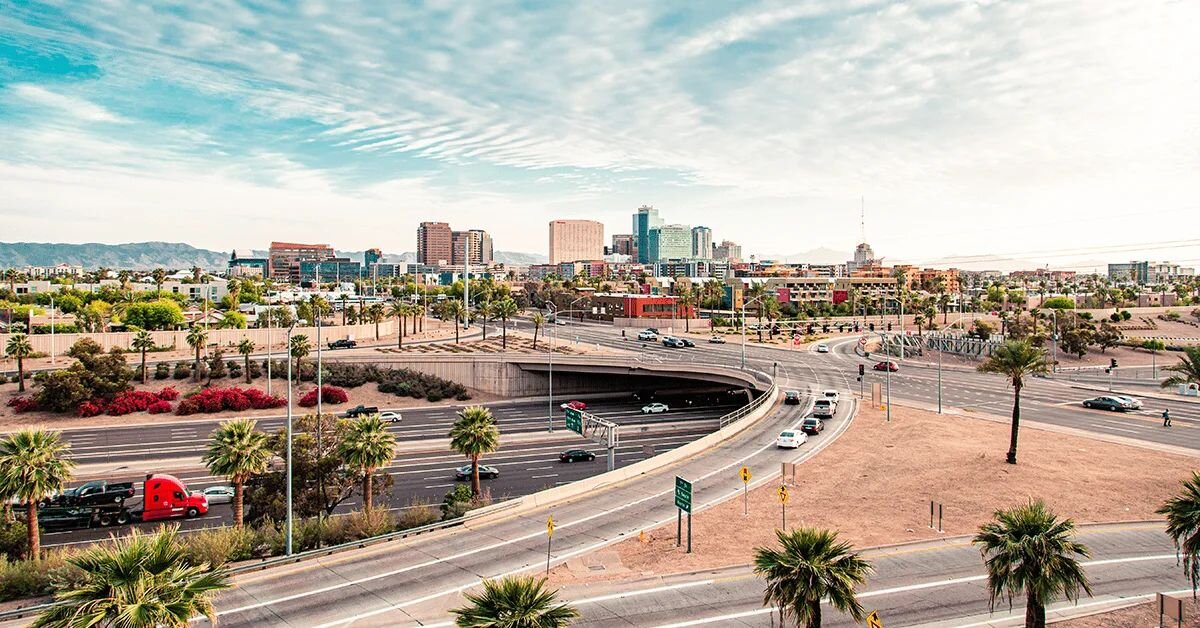
Across the country, professionals eye the Phoenix commercial real estate market as a resilient, fast-growing opportunity in which to invest successfully. The Phoenix commercial real estate market is supported by a resilient job sector, projected to grow 15% in the next decade, and population growth up 20% over the previous ten years.
The Phoenix market's attractive CRE inventory, and multiple corporate regional headquarters position the region as a viable option for investors and tenants alike. Crexi equips individuals seeking Phoenix commercial real estate properties and the agents representing them with an all-in-one platform to buy and sell commercial real estate.
Buyers and tenants harness Crexi's robust marketplace and search tools to browse through thousands of Phoenix-Mesa-Chandler-Scottsdale MSA listings and find the perfect fit. Brokers in Phoenix also utilize Crexi's marketing and listing management tools to connect with potential buyers and guide deals from listing to closing quickly and efficiently. Crexi's suite of robust broker tools connects Phoenix commercial brokers with viable, actively searching leads, no matter where they're based.
As of this writing, Crexi has helped commercial real estate professionals successfully close more than $615 billion in property value and market over half a million properties valued at $7 trillion.
Crexi is proud to serve Phoenix, Mesa, Chandler, Scottsdale, Glendale, Tempe, and beyond as the fastest-growing online commercial real estate platform.

The State of Commercial Real Estate in Phoenix
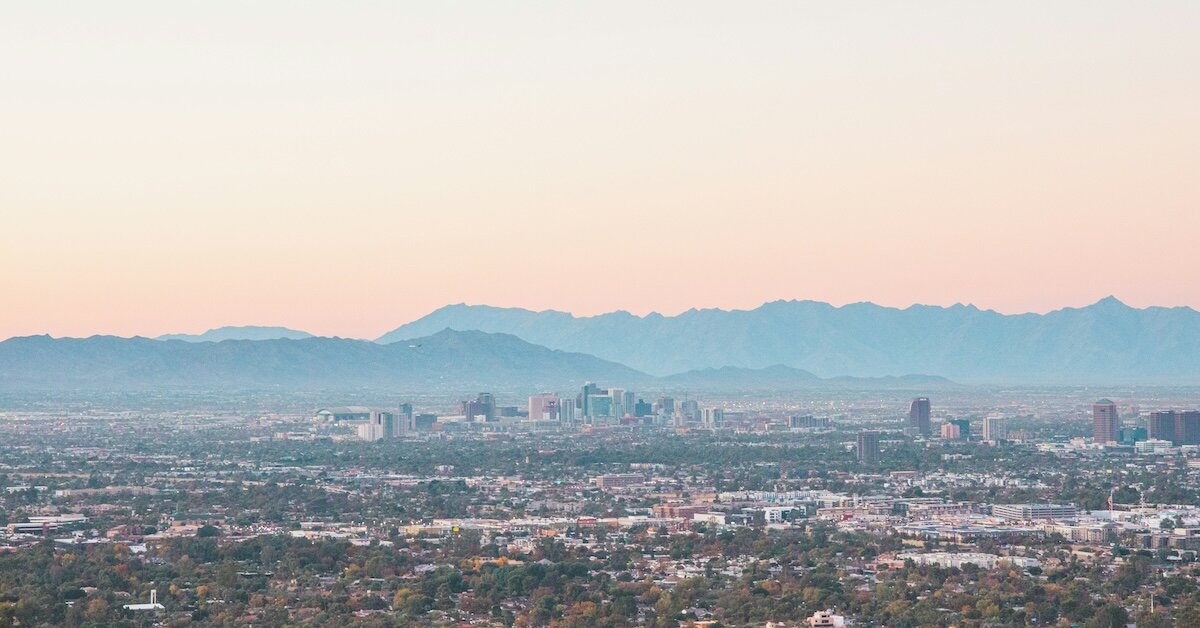
The Phoenix metropolitan area, often referred to as the Valley of the Sun, is located in south-central Arizona. As the state's capital and largest city, Phoenix is known for its vast desert landscape and vibrant urban amenities.
The region is home to architectural marvels like Chase Tower and the Phoenix Convention Center, reflecting the city's dynamic growth and modern outlook. Key cities within the metro area, such as Scottsdale, Tempe, and Mesa, also contribute to its diverse culture and economic robustness.
In recent years, the Phoenix metro area has experienced significant economic and population growth, ranking among the fastest-growing regions in the United States. This expansion is fueled by a strong job market, favorable business climate, and an influx of new residents drawn by the area's quality of life and relatively affordable cost of living.
Real estate development is booming, with substantial investments in both residential and commercial properties. The high-tech manufacturing, healthcare, and renewable energy sectors position Phoenix as a forward-thinking metropolitan area with abundant opportunities for investors and entrepreneurs.
Phoenix Regional Breakdown
Phoenix and Maricopa County have consistently experienced robust population growth, driven by a strong job market and an appealing quality of life. This upward trend reflects the region's ability to attract new residents, contributing to its dynamic economic landscape and fueling demand for housing and commercial real estate.
- The Phoenix-Mesa-Chandler metropolitan area is home to over 5 million, making it the 10th-largest metro in the US by population.
- Phoenix is the capital of Arizona, the seat of Maricopa County, the most populous city in Arizona, and the 5th most populated in the US.
- Maricopa County has added nearly 769,000 residents since 2010, according to the most recent census, boasting a population growth of more than 20%.
- Metropolitan Phoenix is ranked among the ten fastest-growing areas by the National Association of Realtors (NAR).
- Largest cities in the metro area include Phoenix, Mesa, Chandler, Scottsdale, Glendale, Gilbert, Tempe, and Peoria.
- Median age is 37.6, a little less than the figure in the US, based on data from CensusReporter.org.
- Per capita income is $42,286, and median household income is $82,884 (about 10% higher than the amount in the US).
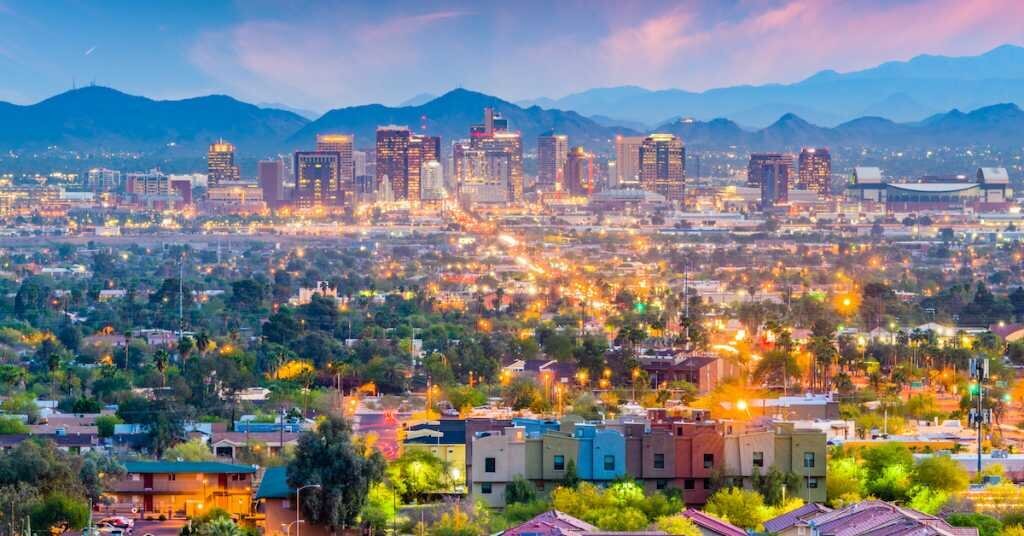
Phoenix Job Market
Phoenix's economy is seeing diversified growth across several key industries, including technology, healthcare, manufacturing, and finance. Major companies such as Intel, Honeywell, and Banner Health have significant operations in the area, contributing to a robust job market.
The region has also seen a surge in venture capital investment, with numerous startups and tech firms setting up shop in the Valley. Additionally, government initiatives like the Greater Phoenix Economic Council (GPEC) and Arizona Commerce Authority (ACA) play pivotal roles in attracting new businesses and supporting economic development.
- The total GDP for Phoenix-Mesa-Scottsdale is over $362 billion, growing by 47% over the past ten years.
- Phoenix is ranked among the top cities for 5-year job growth in the US, according to RealPage Analytics.
- The GPEC projects employment growth of 15% for the next decade (2020-2030), compared to the national average of 10%.
- The unemployment rate in the metropolitan area is at an all-time low of 2.3%, based on April data from the US Bureau of Labor Statistics.
- Top major employers in Phoenix include Banner Health, Amazon, Arizona State University, ON Semiconductor, Avnet, Republic Services, PetSmart, and Intel.
- Key industry sectors are advanced business services, aerospace and defense, autonomous and electric vehicles, bioscience and healthcare innovation, climate technology, finance and insurance, semiconductors, and software.
- The Phoenix area is home to prominent educational institutions, including Arizona State University, Grand Canyon University, and the University of Phoenix. These institutions are renowned for their diverse academic programs and significant student populations.
- Nearly 35% of residents hold bachelor’s or post-graduate degrees.
- Phoenix has emerged as a hotspot for business relocations and commercial real estate developments in 2024. Several high-profile projects are set to reshape the region, including the master-planned development at Loop 202 and Dobbins Road, which will feature 50 acres of retail space.
- The metro area has a well-developed transportation infrastructure, with major interstates like I-10 and I-17, Sky Harbor International Airport (PHX), and an extensive network of highways and railways.
Phoenix Industrial Market
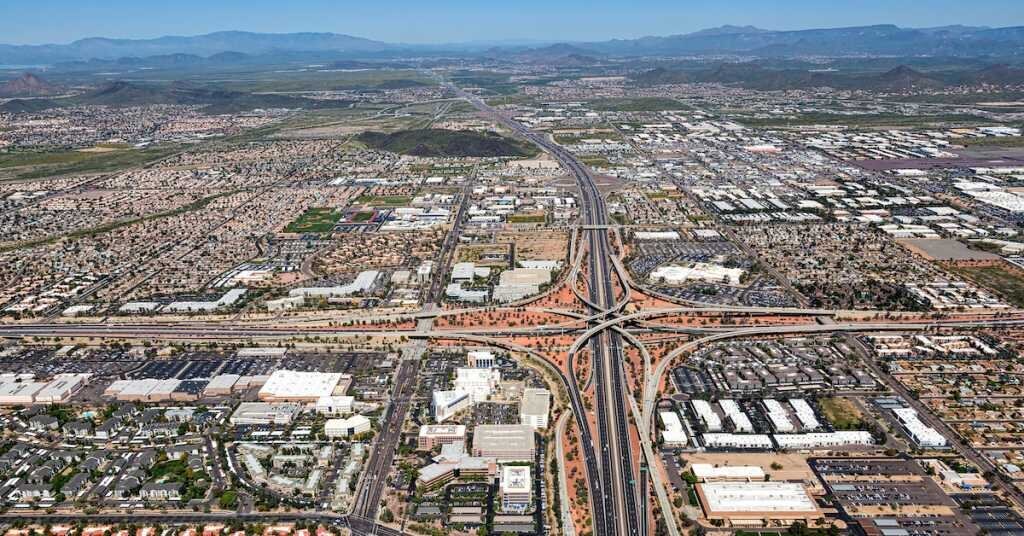
The Phoenix industrial market is grappling with rising vacancy rates due to continued supply growth and increased sublease availability. Despite these challenges, Phoenix maintains the highest construction industrial pipeline in the US, with significant activity in the warehouse/distribution sector. Although construction starts have slowed, the market added 7.9 million square feet of new industrial space in the first quarter, with the Southeast and Southwest Valleys leading in completions.
Market overview (Cushman & Wakefield Q1 2024 Phoenix Industrial Report)
- Inventory: 411,712,919 SF
- Vacancy rate: 10.6%
- Net absorption: 95,694 SF (Q1 2024)
- Under construction: 42,207,375 SF
- Leasing activity: 7,664,966 SF
- Key leases by tenant: E-Commerce Company (confidential), Sologistics, Steelcase
- Largest submarkets: Southwest Valley, Southeast Valley, Airport
Crexi Insights
These are the most recent lease and sales trends from Crexi Insights (as of June 2024):
For Lease (active)
- Asking rate/SqFt (median): $15 per year
- Median SqFt/listing: 4,512
- Days on market: 202
- Total listings on Crexi: 151 spaces
For Sale (active)
- Median asking price: $2.4 million
- Price/SqFt: $234
- Asking cap rate: 6.1%
- Days on market: 141
- Total listings on Crexi: 149
Sales Comps (past 12 months)
- Median sold price: $1.6 million
- Sold price/SqFt: $188
- Total sales volume: $1.91 billion
- Sold cap rate: 6.1%
- Median SqFt sold/transaction: 13,700
- Total SqFt sold: 16.4 million
- Days on market (median): 126
Find Phoenix industrial space for rent.
Phoenix Office Market
The Phoenix office market is experiencing a challenging period, with tenant move-outs surpassing leasing activity, resulting in negative net absorption. The market faces increasing availability combined with the effect of hybrid work models, putting pressure on occupancy levels. Despite this, rental rates have continued their healthy climb, reflecting ongoing demand.
Market overview (Colliers 2024 Q1 Greater Phoenix Office Market Report)
- Inventory: 164,568,000 SF
- Vacancy rate: 15.1%
- Net absorption: -572,000 SF (Q1 2024)
- Deliveries: 39,000 SF
- Under construction: 711,000 SF
- Key lease transactions by tenant: Republic Services, Pulte Home, Verigon
- Largest submarkets: Downtown North, Chandler, Downtown South, Deer Valley Airport
Crexi Insights
For the latest updates on the office market in Phoenix, turn to Crexi Insights. Here are the most recent leasing and sales trends as of June 2024:
For Lease (active)
- Asking rate/SqFt (median): $24 per year
- Median SqFt/listing: 2,032 SF
- Days on market: 297
- Total listings on Crexi: 2,905 spaces
For Sale (active)
- Median asking price: $1.95 million
- Price/SqFt: $300
- Asking cap rate: 6.3%
- Days on market: 151
- Total listings on Crexi: 267
Sales Comps (past 12 months)
- Median sold price: $1 million
- Sold price/SqFt: $207
- Total sales volume: $1.43 billion
- Sold cap rate: 6.1%
- Median SqFt sold/transaction: 7,200 SF
- Days on market (median): 166
Find Phoenix office space for rent.
Phoenix Retail Market
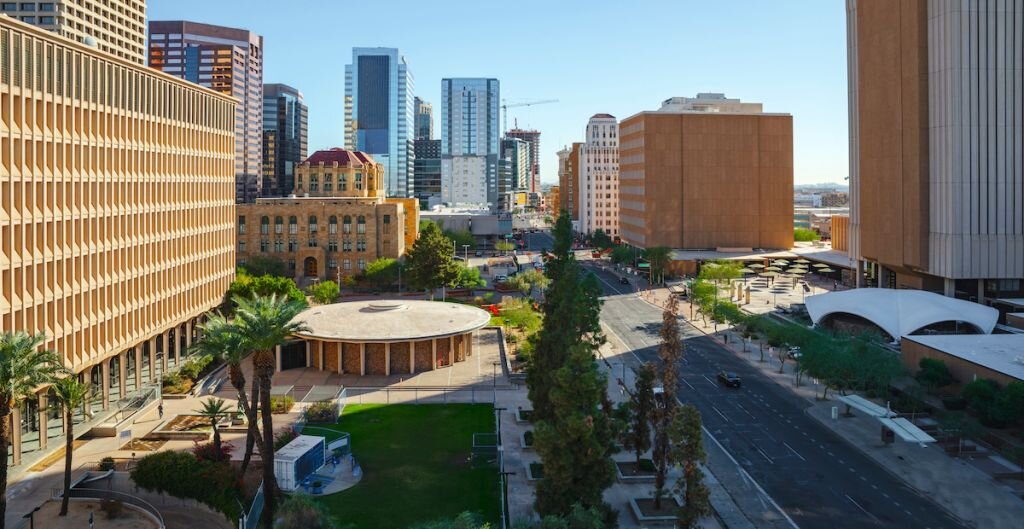
The Phoenix retail market is mixed, with submarkets like the CBD and Sky Harbor Airport boasting low vacancy rates, while areas such as Mesa and Tempe see higher vacancies. Despite recording negative net absorption, submarkets like Northwest Phoenix and Southwest Phoenix posted significant gains. Rental rates have shown a modest upward trend, reflecting ongoing demand, with notable new construction projects underway, particularly in Northwest Phoenix and the Southeast Valley.
Market overview (Cushman & Wakefield Q1 2024 Phoenix Retail Report)
- Inventory: 135,132,773 SF
- Vacancy rate: 4.9%
- Net absorption: -1,664 SF (Q1 2024)
- Under construction: 1,009,233 SF
- Leasing activity: 959,698 SF
- Top lease transactions by tenant: EOS Fitness, Slick City, The Picklr
- Largest submarkets: Southeast Valley, Northwest Phoenix, North I-17, Scottsdale
Crexi Insights
Lease and sales trends from Crexi Insights (as of June 2024):
For Lease (active)
- Asking rate/SqFt (median): $19 per year
- Median SqFt/listing: 2,304 SF
- Days on market: 348
- Total listings on Crexi: 2,125 spaces
For Sale (active)
- Median asking price: $2.77 million
- Price/SqFt: $356
- Asking cap rate: 6.0%
- Days on market: 140
- Total listings on Crexi: 325
Sales Comps (past 12 months)
- Median sold price: $1.83 million
- Sold price/SqFt: $268
- Total sales volume: $1.45 billion
- Sold cap rate: 6.1%
- Median SqFt sold/transaction: 5,549 SF
- Days on market (median): 144
Find Phoenix retail space for rent.
Phoenix Multifamily Market
The Phoenix multifamily market started the year with strong rental demand and a significant influx of new units, leading to a slight increase in vacancy rates. Despite this, the market has maintained positive net absorption for six consecutive quarters, with Chandler/Queen Creek and Mesa/Gilbert submarkets recording the largest gains. While asking rents have decreased modestly year-over-year, they remain significantly higher compared to the end of 2019, and concessions are becoming more prevalent as developers and landlords navigate the heightened supply.
Market overview (Cushman & Wakefield Q1 2024 Phoenix Multifamily Report)
- Total housing units: 2,063,233
- Multi-unit inventory: 340,780 units
- Vacancy rate: 6.9%
- Average asking rent: $1,641
- Net absorption: 3,311 (Q1 2024)
- Under construction: 40,473 units
- Planned units: 27,275
- Largest submarkets: Mesa/Gilbert, West Phoenix, Chandler/Queen Creek, Northwest Valley
Crexi Insights
Here are the most recent Multifamily Insights from Crexi (as of June 2024):
For Sale (active)
- Median asking price: $1.37 million
- Price/SqFt: $329
- Price/Unit: $253,000
- Asking cap rate: 5.8%
- Days on market: 77
- Total listings on Crexi: 101
Sales Comps (past 12 months)
- Median sold price: $360,000
- Sold price/SqFt: $274
- Sold price/unit: $190,000
- Total sales volume: $22.3 billion
- Sold cap rate: 6.1%
- Total SqFt sold: 16.3 million
- Days on market (median): 219
Find Phoenix multifamily property for sale.
Get more in-depth Phoenix market data with Crexi Intelligence.


