The St. Louis Commercial Real Estate Market

January 23, 2026
Key Takeaways
- St. Louis reversed its population decline in 2024, recording its largest influx of new residents since 2010, while maintaining a cost of living approximately 6% below the national average with housing costs 27% lower than the U.S. average.
- The metro's unemployment rate of 3.7% sits nearly a full point below the national average, supported by a diverse economic base spanning healthcare, advanced manufacturing, financial services, and logistics rather than dependence on a single industry.
- Industrial vacancy stands at just 2.6% with over 2.1 million square feet of positive absorption year-to-date, reflecting strong demand from logistics, food production, and manufacturing tenants drawn to the region's central location and major transportation infrastructure.
- Retail space has reached historic lows in vacancy at 4.7%, with limited new construction keeping available space tight and pushing tenants to move quickly when desirable locations become available.
- St. Louis benefits from $8.9 billion in planned infrastructure investments and its position as a freight leader, with four major interstates, a Mississippi River port, and Lambert International Airport providing access to key U.S. markets within a day's drive.
St. Louis has long been a place where established industries, research institutions, and growing businesses intersect, creating steady interest from investors and tenants across the country. As activity in the region continues to evolve, Crexi gives market participants a clear way to evaluate opportunities, compare listings, and connect with local experts.
The platform has supported more than $610 billion in closed commercial real estate transactions and helped market over $7 trillion in property value nationwide. Buyers, tenants, and brokers use Crexi every day to explore St. Louis listings, analyze market conditions, and move deals forward with greater speed and confidence.
Crexi is proud to serve St. Louis and its surrounding communities, including Florissant, Clayton, and Ferguson, as the region’s fastest-growing online CRE marketplace. With tools built for modern dealmaking, we help real estate professionals navigate an active metro where both long-term stability and new investment opportunities continue to take shape.

St. Louis Commercial Real Estate
St. Louis occupies a unique position in the Midwest: it’s a metro large enough to support major industry clusters, but accessible enough for businesses seeking affordability, talent, and room to grow. Its location along the Mississippi River and several national transportation routes has strengthened the region’s role in logistics, manufacturing, and distribution, while its universities and medical institutions continue to attract research-driven companies and skilled workers.
Across the metro, historic neighborhoods, established suburbs, and revitalized districts create a mix of environments that appeal to a wide range of employers and residents. Areas like Clayton, Chesterfield, and University City continue to draw corporate activity, while emerging pockets closer to the urban core are seeing renewed interest from developers and small businesses.
Today, St. Louis’s CRE landscape reflects the characteristics that have long defined the metro: steady demand, a diverse economic foundation, and ongoing reinvestment. Companies across healthcare, finance, aerospace, and tech remain active contributors to the local economy, helping maintain a stable base for office, industrial, and retail activity. With its balanced pace of growth and strong quality of life, the metro remains a place where commercial projects can gain traction and deliver long-term value.
St. Louis Regional Context
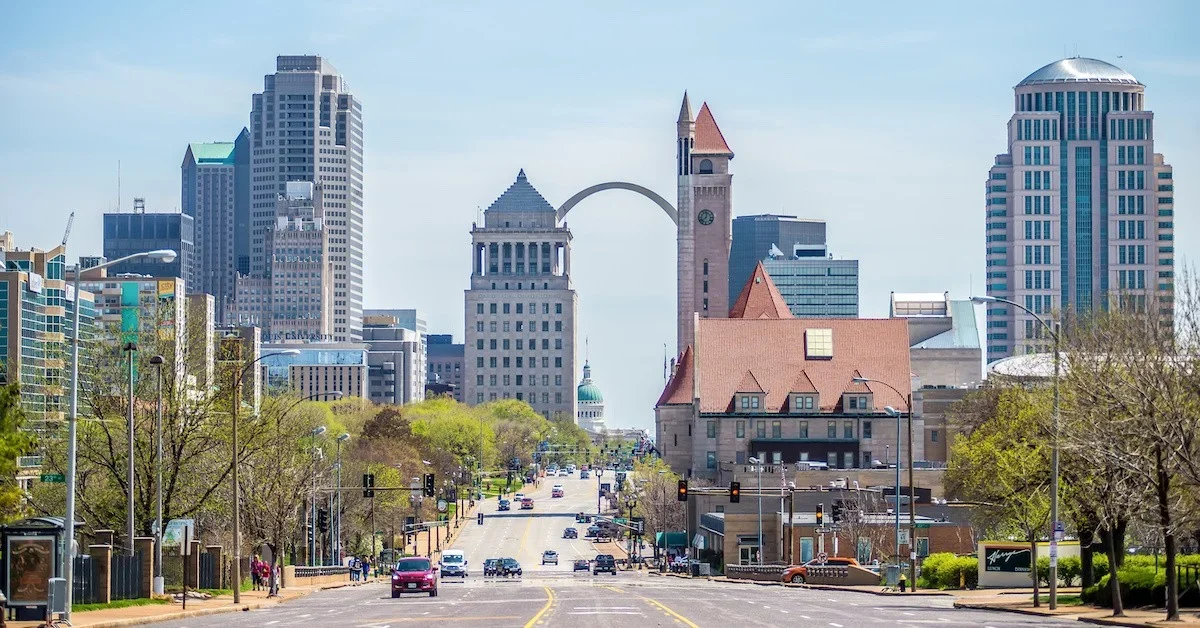
St. Louis is entering a new chapter, supported by steady population gains, affordable housing, and a growing focus on neighborhood investment. The metro area stretches across eastern Missouri and western Illinois, anchored by the City of St. Louis and St. Louis County, with key communities like Clayton, Chesterfield, Florissant, and Kirkwood, as well as nearby Illinois markets such as Belleville and Alton. After years of slow change, more people are choosing to stay or move back, drawn by stable incomes and a cost of living that remains approachable.
This mix of affordability, established communities, and targeted revitalization is reshaping how the region grows. Together, these factors are contributing to a metro that feels more grounded and forward-looking, with conditions that support long-term demand across both city and suburban markets.
- Close to 2.8 million residents live in the St. Louis, MO metropolitan area. Of those, more than 281,000 reside within city limits.
- The median age in the metro area is 40.2, slightly higher than the U.S. overall figure.
- In 2024, St. Louis began to reverse its declining population, gaining its largest influx of new residents since 2010.
- Per capita income in St. Louis is $44,804, and the median household income is $78,224. Nearly 40% of metro area residents earn over $100,000 per year.
- The cost of living in St. Louis, MO is about 6% lower than the national average, largely thanks to affordable housing options (housing costs are about 27% lower than the U.S. average).
- St. Louis has earned recognition for its sustainability efforts, including multiple grants from the Urban Sustainability Directors Network (USDN).
- The city has also increased focus on revitalization and community initiatives, with projects such as the $50 million transformation of the Grand Center arts and culture district and more than $1.1 million in Neighborhood Plan Implementation grants.
St. Louis Job Market
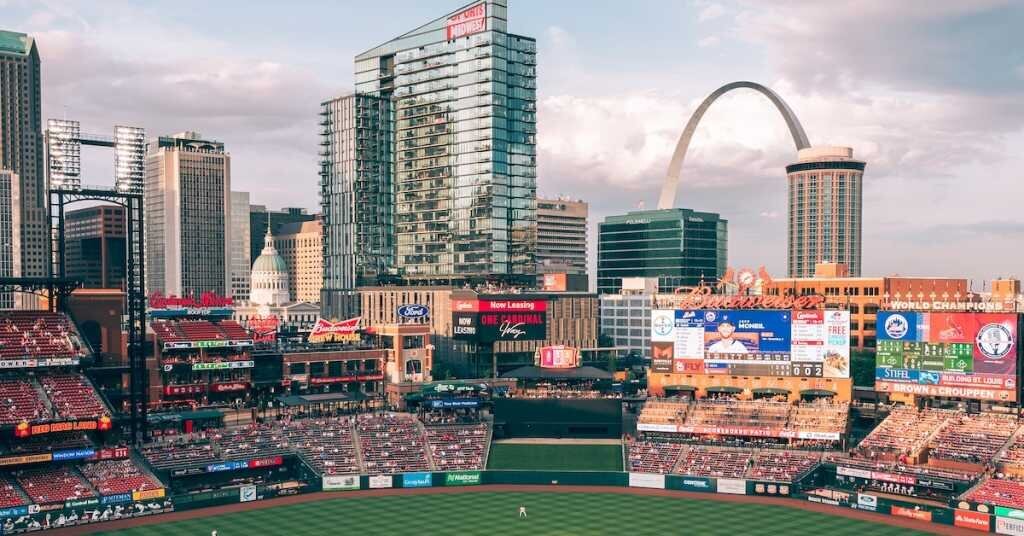
St. Louis benefits from a labor market powered by scale, stability, and long-standing industry depth. The region supports a wide range of employers, from global manufacturers and healthcare systems to financial services firms and research institutions, creating a broad base of employment rather than reliance on a single sector. Its concentration of universities and medical centers continues to feed the workforce with skilled talent, supporting both established companies and newer growth areas. At the same time, ongoing infrastructure and freight investments strengthen the metro’s role as a place where businesses can operate efficiently and expand with confidence.
- The total GDP of the St. Louis metropolitan area surpassed $226.5 billion in 2023, increasing by more than 50% since 2020.
- The unemployment rate is 3.7% as of August 2025, nearly a full point lower than the national average.
- Target industries in St. Louis span four key sectors: advanced manufacturing, metals, food and agricultural technology, and chemicals.
- Several Fortune 500 companies are based in St. Louis, including Centene, Reinsurance Group of America, Emerson Electric, Jones Financial-Edward Jones, Graybar Electric, Post-Food Consumer Products, and Core & Main.
- Major employers in the St. Louis metro area include BJC HealthCare, Washington University in St. Louis, WalMart, Boeing, and SSM Health.
- About one-third of the colleges and universities in Missouri are located within the St. Louis metropolitan area. Top schools include Washington University in St. Louis, Saint Louis University, and the University of Missouri-St.Louis.
- Over 39% of metro area residents have a Bachelor’s degree or higher, a rate that is about 10% higher than the overall figure for the U.S.
- Infrastructure initiatives included in the 2026 Priority Projects List total nearly $8.9 billion, aiming at supporting crucial improvements to support business and industry throughout the region.
- St. Louis stands as a leader in freight and industrial development, outperforming its peer cities in terms of economic output, workforce readiness, and other critical factors.
- St. Louis is supported by four major interstates (I-44, I-55, I-64, and I-70), a major Mississippi River port, and Lambert International Airport, giving businesses efficient access to key U.S. markets within a day’s drive.
St. Louis Industrial Market
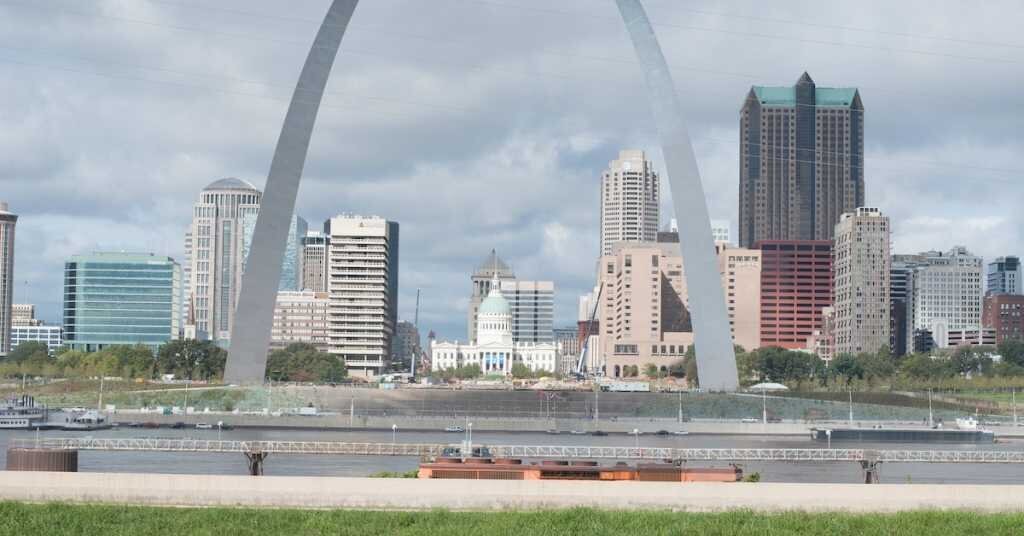
St. Louis continues to show strength as a key player in the Midwest industrial market. Leasing activity remains steady, with strong tenant interest across logistics, food production, and manufacturing. Vacancy has stayed low for several quarters, even as new development comes online - a sign that demand is keeping pace with supply. Activity is especially concentrated in North County, Metro East, and St. Louis City, where users benefit from the region’s central location and reliable access to major transportation routes. As speculative construction slows and build-to-suit projects rise, the market is expected to remain competitive and well-balanced in the near term.
Market overview (Cushman & Wakefield Q3 2025)
- Inventory: 267,876,397 SF
- Vacancy rate: 2.6%
- Absorption: 2,122,737 (YTD)
- Key leases by tenant: Unilever (513,474 SF), Buske Lines, Inc. (200,000 SF), Confluence Genetics, LLC (99,463 SF)
- Under construction: 3,054,256 SF
- Largest submarkets: North County, St. Louis City, Metro East
Crexi Insights
These are the most recent lease and sales St. Louis industrial trends from Crexi Insights (as of January 2026):
For Lease (active)
- Asking rate/SqFt (median): $7 per year
- Median SqFt/listing: 11,100
- Days on market: 293
- Total listings on Crexi: 157 spaces
For Sale (active)
- Median asking price: $1.2 million
- Price/SqFt: $69
- Days on market: 242
- Total listings on Crexi: 88 listings for a total of 4 million SF
Sales Comps (past 12 months)
- Median sold price: $405,200
- Sold price/SqFt: $51
- Total sales volume: $65.1 million
- Median SqFt sold/transaction: 8,000
- Total SqFt sold: 1.6 million
- Days on market (median): 398
Find St. Louis industrial space for rent.
St. Louis Office Market
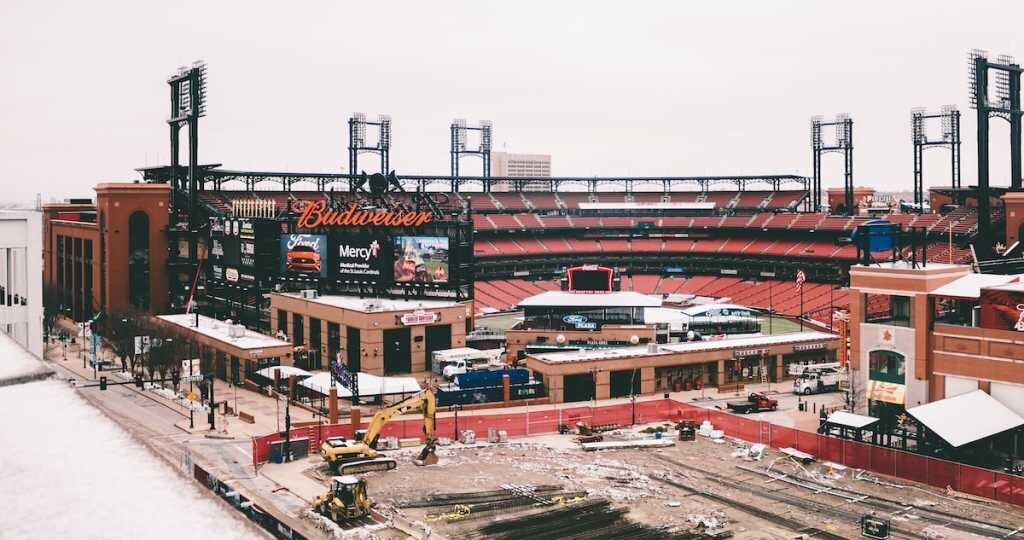
The St. Louis office market is finding its footing amid a period of change. While vacancy remains elevated, interest has held steady in Class A properties that offer strong amenities and efficient layouts. Activity is picking up in key submarkets like Clayton and West County, where high-quality spaces are drawing tenant attention. As more companies solidify long-term plans, well-located offices with built-in flexibility are leading the way.
Market overview (Cushman & Wakefield Q3 2025)
- Inventory: 50,875,323 SF
- Vacancy rate: 17.7%
- Absorption: -662,996 SF YTD
- Key leases by tenant: PennyMac Mortgage (77,441 SF), Delta Dental (69,000 SF), Nidec (51,342 SF)
- Under construction: 0 SF
- Largest submarkets: West County, St. Louis City, Central Business District, Clayton
Crexi Insights
Crexi delivers current information on the St. Louis office market. Here are the latest leasing and sales patterns (as of January 2026):
For Lease (active)
- Asking rate/SqFt (median): $17 per year
- Median SqFt/listing: 2,284 SF
- Days on market: 288
- Total listings on Crexi: 815 spaces
For Sale (active)
- Median asking price: $799,500
- Price/SqFt: $105
- Asking cap rate: 7.4%
- Days on market: 249
- Total listings on Crexi: 114 listings totaling 2.7 million SF
Sales Comps (past 12 months)
- Median sold price: $340,500
- Sold price/SqFt: $56
- Total sales volume: $182.2 million
- Median SqFt sold/transaction: 4,318 SF
- Days on market (median): 440
Find St. Louis office space for rent.
St. Louis Retail Market
Retail real estate in St. Louis is enjoying a strong run, with demand staying consistent and vacancy reaching historic lows. Limited new development has kept space tight, pushing tenants to act quickly when desirable locations become available. Larger-format users and national brands continue to secure anchor positions, while local retailers benefit from the region’s steady consumer base. With construction activity gradually returning, the market is poised to maintain its momentum going forward.
Market overview (Cushman & Wakefield Q3 2024)
- Inventory: 66,669,124 SF
- Vacancy rate: 4.7%
- Absorption: 400,347 SF YTD
- Under construction: 386,535 SF
- Key leases by tenant: Dierbergs (75,000 SF), Target (41,200 SF), Savers (18,895 SF)
- Largest submarkets: Illinois, South County, St. Charles
Crexi Insights
St. Louis retail lease and sales trends from Crexi Insights (as of January 2026):
For Lease (active)
- Asking rate/SqFt (median): $15 per year
- Median SqFt/listing: 2,309 SF
- Days on market: 416
- Total listings on Crexi: 472 spaces
For Sale (active)
- Median asking price: $806,100
- Price/SqFt: $114
- Asking cap rate: 6.6%
- Days on market: 217
- Total listings on Crexi: 134 listings for a total of 1.8 million SF
Sales Comps (past 12 months)
- Median sold price: $387,400
- Sold price/SqFt: $75
- Total sales volume: $146.1 million
- Sold cap rate: 7.1%
- Median SqFt sold/transaction: 4,605 SF
- Days on market (median): 323
Find St. Louis retail space for rent.
St. Louis Multifamily Market
After several years of elevated development, St. Louis’ multifamily market is beginning to find its balance. A slowdown in new deliveries has helped ease pressure on vacancy, while steady absorption signals ongoing renter demand. Rent growth has picked up modestly, and interest remains strong in well-located, professionally managed properties. As the market adjusts to a more sustainable pace, St. Louis continues to offer a range of housing options for residents across income levels and lifestyle needs.
Market overview (Cushman & Wakefield Q3 2025)
- Total housing units: 1,279,935 (Census Reporter)
- Inventory: 123,761 units
- Vacancy rate: 10.1%
- Average effective rent/unit: $1,333
- Effective rent growth: 3% YoY
- Under construction: 1,931 units
Crexi Insights
Here are the most recent multifamily Insights from Crexi (as of January 2026):
For Sale (active)
- Median asking price: $709,500
- Price/SqFt: $83
- Price/Unit: $89,900
- Asking cap rate: 6.9%
- Days on market: 91
- Total listings on Crexi: 74 listings totaling 1.8 million SF
Sales Comps (past 12 months)
- Median sold price: $220,100
- Sold price/SqFt: $76
- Sold price/unit: $94,400
- Total sales volume: $875.2 million
- Sold cap rate: 8.4%
- Total SqFt sold: 5.2 million
- Days on market (median): 113
Find St. Louis multifamily property for sale.
Get more in-depth St. Louis market data with Crexi Intelligence.
Frequently Asked Questions
What makes St. Louis attractive for commercial real estate investment?
St. Louis offers a cost of living about 6% below the national average, strategic central location with access to major U.S. markets within a day's drive, and a diverse economy spanning healthcare, manufacturing, financial services, and logistics. The metro's affordability, skilled workforce, and robust transportation infrastructure create stable demand across all commercial property types.
How is the St. Louis industrial market performing?
The industrial market is exceptionally strong with vacancy at just 2.6% and over 2.1 million square feet of positive absorption year-to-date as of Q3 2025. Strong demand from logistics, food production, and manufacturing tenants continues to keep pace with new supply.
What is the current state of the St. Louis office market?
Office vacancy stands at 17.7% as the market adjusts to changing workspace needs, though Class A properties with strong amenities in submarkets like Clayton and West County continue to attract tenant interest. There is currently no new construction underway as the market finds its footing.
Is St. Louis experiencing population growth?
Yes, St. Louis reversed its population decline in 2024, recording its largest influx of new residents since 2010. The metro area is now home to close to 2.8 million residents, drawn by affordable housing and stable job opportunities.
What is the unemployment rate in St. Louis?
St. Louis maintains an unemployment rate of 3.7% as of August 2025, nearly a full point lower than the national average. The region benefits from diverse major employers and a highly educated workforce, with over 39% of residents holding a bachelor's degree or higher.
How is the retail market performing in St. Louis?
Retail vacancy has reached historic lows at 4.7% with over 400,000 square feet of positive absorption year-to-date. Limited new development has kept space tight, creating a competitive market where tenants must move quickly on desirable locations.
What infrastructure advantages does St. Louis offer?
St. Louis is served by four major interstates, a Mississippi River port, and Lambert International Airport, providing efficient access to key U.S. markets. Nearly $8.9 billion in infrastructure projects are planned for 2026 to support continued business and industry growth.


