The Boston Commercial Real Estate Market
Category: Markets

Boston, Massachusetts represents a bustling New England market with viable commercial real estate opportunities in the Northeast corridor. A technology and science research hotbed, the city ranks among the top in the US for entrepreneurial growth and innovation. Interested investors and prospective tenants - local and nationwide - utilize Crexi to find the ideal Boston commercial property for their needs.
Brokers in Boston and representing Boston assets harness Crexi's listing capabilities to quickly market and manage properties from list to close. Using Crexi, brokers instantly connect with cohorts of viable buyers and tenants who've already indicated an interest in Boston's marketplace.
As of this writing, Crexi has helped brokers and buyers navigate more than $615 billion in commercial property transactions and marketed assets representing more than $7 trillion in value. Crexi is proud to serve Boston, Waltham, Newton, Quincy, Somerville, and the surrounding areas as the fastest-growing online commercial real estate marketplace.

The State of Commercial Real Estate in Boston
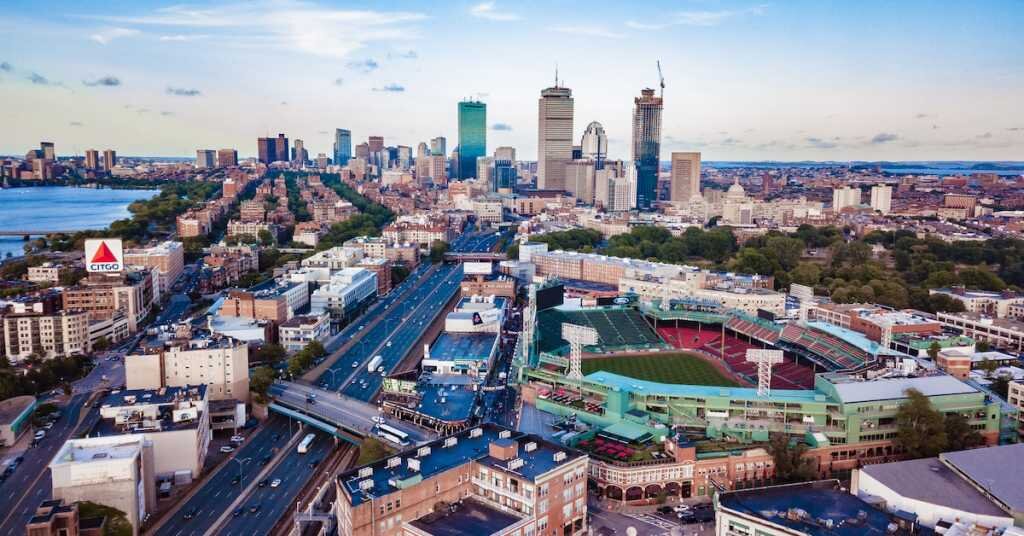
Boston is the capital of Massachusetts and the largest city in the New England region. Situated along the eastern coast of Massachusetts, it is steeped in American history and a cradle for education and innovation, housing some of the world's most prestigious universities and hospitals.
This rich academic and healthcare environment fuels the city's economy, attracting businesses, talent, and investment from across the globe. Strong sectors in finance, technology, and biotechnology also drive the economic landscape, making it a hub for professionals and corporations alike.
Boston's commercial real estate market has seen a notable trend toward urban development and revitalization, focusing on sustainable and mixed-use projects that address the growing demand for residential and commercial spaces.
With its robust economy, diverse population, and commitment to innovation and sustainability, Boston offers compelling opportunities for investors looking to capitalize on the area's growth and stability.
Boston Regional Breakdown
Boston is the 10th most populous urban area in the US, boasting a growth rate of more than 9% between 2010 and 2020, nearly double that of the prior decade. This growth reflects the city's ability to attract a skilled workforce and retain graduates from its world-class institutions, solidifying its appeal as a leading hub for education, healthcare, and technology sectors.
- Boston is home to over 650,000, with 4.9 million residing in the metropolitan area.
- Most populated cities in the metro area include Boston, Worcester, Providence, Cambridge, and Manchester.
- Boston is projected to have a population of approximately 741,000 in 2030 and 800,000 in 2050, according to research from the Boston Planning & Development Agency.
- The median age in Boston is 39.5, about the same as in the US.
- About 40% of the population is between 20 and 49.
- Per capita income is $59,165, and median household income is $104,299. Both figures are about 40% greater than the median amounts in the US, based on data from CensusReporter.org.

The Boston Job Market
Boston's economic landscape thrives on a foundation of technological innovation, healthcare excellence, and educational prowess. The city is home to tech giants like Boston Dynamics and pioneering startups like Toast (a restaurant management platform) and Hubspot (a leader in inbound marketing and sales software).
Substantial venture capital is flowing into sectors like biotech, digital health, and clean technology, thanks to its proximity to world-renowned institutions like MIT and Harvard. Financial services also play a pivotal role, with firms such as Fidelity Investments headquartered here contributing significantly to job creation and economic stability.
- GDP for Boston-Cambridge-Newton is $571.7 billion, up from $433.8 billion in 2017, according to data from the St. Louis Fed.
- The employed population is nearly 2.7 million, and the unemployment rate is 3.3%.
- WalletHub ranks Boston as the fourth-best city for STEM jobs and the 10th-best city for finding a job based on criteria such as job opportunities, employment growth, and annual median wage.
- Leading industries include aerospace and robotics, government and defense, information technologies, financial services, life sciences, advanced manufacturing, and clean energy.
- Largest employers in the Boston area include Brigham & Women’s Hospital, Dan Farber Cancer Institute, Massachusetts General Hospital, Raytheon Systems, Boston Medical Center, Dell EMC Corporation, and the Massachusetts Bay Transportation Authority.
- Top publicly traded companies in Boston (by revenue) are General Electric, Liberty Mutual, State Street, and American Tower.
- Bloomberg reports that Boston is the third-top metro for VC investment, attracting nearly $62 million between 2019 and 2021.
- Among the leading venture capital firms investing in Boston are General Catalyst Partners, Battery Ventures, and Polaris Partners.
- The Massachusetts state government promotes economic growth through initiatives like the Life Sciences Act, which injects funding into biotechnology research and development.
- Suffolk Downs, a mixed-use development project aiming to transform the former racetrack into a vibrant new neighborhood with residential, retail, and office spaces, is one of many significant commercial real estate developments.
- The recent relocation of Amazon's tech hub to the Seaport District demonstrates the city's appeal to leading tech firms, bringing new jobs and further driving Boston's tech ecosystem.
- The Boston metropolitan area is home to Harvard University, Massachusetts Institute of Technology (MIT), and Boston University, renowned for their academic excellence, research contributions, and significant impact on the local and global educational landscape.
- Over 51% of residents hold a bachelor’s degree or an advanced degree, about 1.4 times the rate in the US.
- Boston's transportation infrastructure is anchored by Logan International Airport (BOS), which serves as a hub for rail and bus networks, including the MBTA. It is also crisscrossed by major interstates like I-90 (Massachusetts Turnpike) and I-93, and the Port of Boston supports both cargo and passenger services.
Boston Industrial Market
The Boston industrial market is on solid footing, with the overall vacancy rate steady. The broader industrial sector and the warehouse/distribution segments are seeing positive net absorption. Leasing activity primarily focuses on warehouse/distribution sectors in the 495 North submarkets. New speculative warehouse developments, accounting for a significant portion of the market's pipeline, may push asking rents to record highs as these high-quality projects come online.
Market overview (Cushman & Wakefield Q1 2024 Boston Industrial Report)
- Inventory: 164,749,325 SF
- Vacancy rate: 7.2%
- Absorption: 252,870 SF (Q1 2024)
- Completions: 270,600 SF
- Under construction: 3,620,291 SF
- Key leases by tenant: Zoll Medical, Christian Book Fulfillment, Staples, Scholastic Book Fairs
- Largest submarkets: 495 South, 495 North, 128 South
Crexi Insights
These are the most recent Boston industrial lease and sales trends from Crexi Insights (as of May 2024):
For Lease (active)
- Asking rate/SqFt (median): $12 per year
- Median SqFt/listing: 5,360
- Days on market: 231
- Total listings on Crexi: 18 spaces
For Sale (active)
- Median asking price: $1.18 million
- Price/SqFt: $302
- Days on market: 475
- Total listings on Crexi: 4
Sales Comps (past 12 months)
- Median sold price: $7.03 million
- Sold price/SqFt: $273
- Total sales volume: $64.7 million
- Median SqFt sold/transaction: 6,355
- Total SqFt sold: 471,000
Find Boston industrial space for rent.

Boston Office Market
The Boston office market is experiencing increased vacancies across Boston, Cambridge, and the suburbs. With eight consecutive quarters of negative net absorption, the trend has resulted in a tenant-favorable landscape, providing ample choices and leverage in lease negotiations.
However, this scenario may present a unique opportunity for investors. The current environment may allow for acquisitions at prices lower than previously anticipated, with a backdrop of cautious optimism for a gradual market recovery.
Market overview (Colliers 24Q1 Boston Office Market Report)
- Inventory: 187,699,000 SF
- Vacancy rate: 23.0%
- Net absorption: -2,433,000 SF (Q1 2024)
- Net new deliveries: -77,000 SF
- Under construction: 2,564,000 SF
- Key leases by tenant: M&T Bank, Grant Thornton, Sick, Inc.
- Largest submarkets: Central Business District, 128 Belt, 495 Belt
Crexi Insights
For the latest updates on the office market in Boston, turn to Crexi Insights. Here is the detailed information on the recent sales and leasing trends as of May 2024.
For Lease (active)
- Asking rate/SqFt (median): $33 per year
- Median SqFt/listing: 3,600 SF
- Days on market: 464
- Total listings on Crexi: 145 spaces
For Sale (active)
- Median asking price: $400,000
- Price/SqFt: $654
- Days on market: 178
- Total listings on Crexi: 9
Sales Comps (past 12 months)
- Median sold price: $2.85 million
- Sold price/SqFt: $399
- Total sales volume: $582 million
- Median SqFt sold/transaction: 2,976 SF
- Days on market (median): 186
Find Boston office space for rent.

Boston Retail Market
The Boston retail market boasts one of the nation's lowest vacancy rates, similar to those found in Miami and Raleigh, according to The Real Deal. A combination of high area median incomes and limited supply has led to an uptick in average asking rents and a decrease in retail vacancies. Major shopping hubs like Newbury Street and the Prudential Center are two examples of how retail in Boston is thriving.
Market overview (Cushman & Wakefield U.S. Shopping Center Reports Q1 2024)
- Inventory: 72,242,394 SF
- Vacancy rate: 3.5%
- Net absorption: 92,084 SF (Q1 2024)
- Deliveries: 0 SF (Q1 2024)
- Under construction: 62,090 SF
Crexi Insights
Boston retail lease and sales trends from Crexi Insights (as of May 2024):
For Lease (active)
- Asking rate/SqFt (median): $32 per year
- Median SqFt/listing: 3,000 SF
- Days on market: 271
- Total listings on Crexi: 215 spaces
For Sale (active)
- Median asking price: $934,000
- Price/SqFt: $297
- Asking cap rate: 6.0%
- Days on market: 150
- Total listings on Crexi: 14
Sales Comps (past 12 months)
- Median sold price: $1.34 million
- Sold price/SqFt: $488
- Total sales volume: $375 million
- Sold cap rate: 5.1%
- Median SqFt sold/transaction: 3,050 SF
- Days on market (median): 186
Find Boston retail space for rent.

Boston Multifamily Market
The Boston multifamily market is witnessing rising vacancies and minimal rent growth as the supply of new multifamily units continues to overshadow demand. At the end of 2023, vacancies exceeded the 10-year historical average, with a significant imbalance between multifamily completions and starts, leading to the largest vacancy rate increase in three years.
Looking ahead, the market could face further softening due to supply and demand dynamics, including a potential job growth slowdown and the effects of macroeconomic forces. However, Boston's high proportion of renting households and the relative costliness of home buying may provide some cushion against these pressures, creating a level of stability within the market.
Market overview (Colliers 23Q4 Multifamily Market Report)
- Total housing units: 2,064,220
- Multi-unit inventory: 239,537 units
- Vacancy rate: 5.9%
- Asking rent per unit: $2,718
- Under construction: 14,043 units
- Largest submarkets: Boston, Route 128 South, Inner Suburbs, Route 495 North
Crexi Insights
Here are the most recent Boston multifamily Insights from Crexi (as of May 2024):
For Sale (active)
- Median asking price: $2.01 million
- Price/SqFt: $569
- Price/Unit: $525,000
- Asking cap rate: 5.6%
- Days on market: 165
- Total listings on Crexi: 24
Sales Comps (past 12 months)
- Median sold price: $976,000
- Sold price/SqFt: $330
- Sold price/unit: $400,000
- Total sales volume: $1.16 billion
- Sold cap rate: 5.1%
- Total SqFt sold: 3.26 million
- Days on market (median): 237
Find Boston multifamily apartments for sale.
Get more in-depth Boston market data with Crexi Intelligence.