8 Cities with Highest Industrial Demand in 2022
Category: Markets

When it comes to industrial properties, some cities are hotter tickets than others. If you’re an investor looking for the best markets to put your money in, then check out this list of eight cities with high industrial demand.
According to the Emerging Trends in Real Estate Report 2022 from PwC and the Urban Land Institute, the following cities have the strongest ‘buy’ recommendations. Rankings draw upon key investment criteria, including the growth of e-commerce and logistics demand, the imbalance between supply and demand, leasing activity, and new construction of industrial property.
Demographic data for each metropolitan area is from the U.S. Census Bureau, CensusReporter.org, Data USA, and the U.S. Bureau of Labor Statistics. Statistics for each commercial real estate market are from NAR’s Commercial Real Estate Metro Market Reports for Q1 2022 while pricing data is from Crexi Intelligence.
Cincinnati
The diversity of its economy helps to insulate Cincinnati from economic downturns experienced by other cities. Five of the top industries in Cincinnati are health care, educational services, professional and business services, manufacturing, and retail trade.
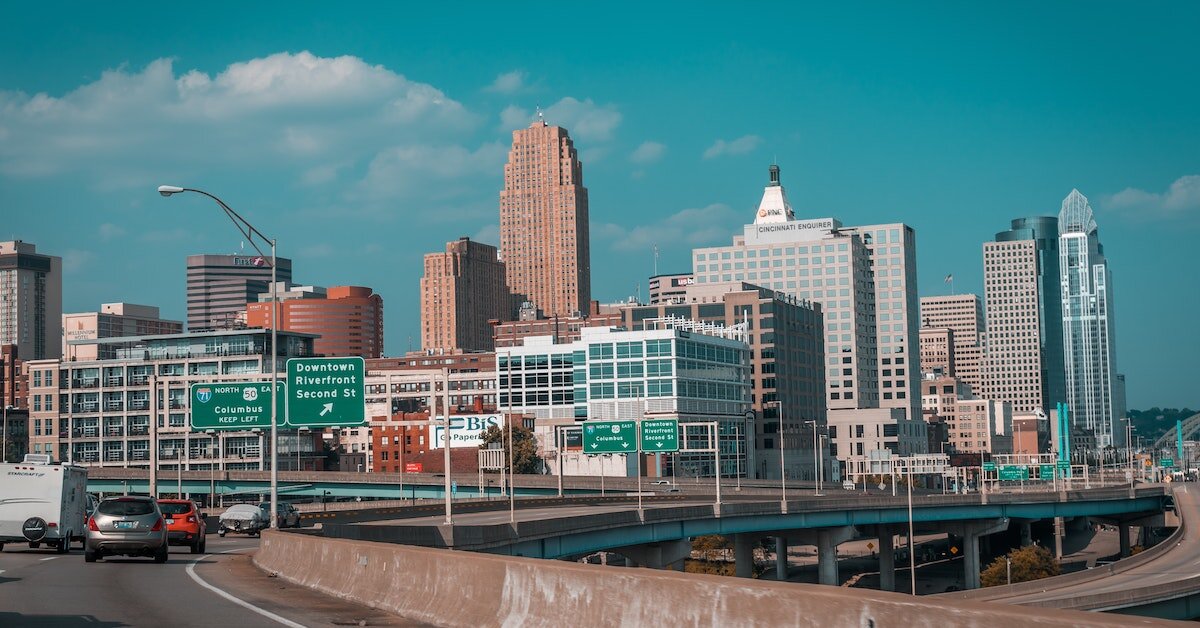
The Cincinnati market is prime for industrial real estate investment due to its diverse economy, lack of supply relative to demand, and increasing leasing activity and new construction. These trends are expected to continue into 2022 and beyond, making Cincinnati an excellent market for industrial investors.
- Population: 2,214,265
- Population growth (year over year): 1.38%
- Job growth (year over year): 2.12%
- Unemployment rate: 3.0%
- Median age: 38.0
- Per capita income: $35,861
- Median household income: $66,435
- Total industrial inventory: 322,348,576 SF
- Average asking rent: $6.00/SF per year, NNN
- Vacancy rate: 4.2%
- Absorption (past 12 months): 6,760,534 SF
- Under construction: 4,526,177 SF
- Investment sales trends: $229 million in Q1 2022, median sales price $69/SF, market cap rate 7.5%
Inland Empire
Located in Southern California, due east of Los Angeles, this metropolitan area is seeing a high demand for industrial property due to the growth of e-commerce and logistics companies. These businesses are attracted to the Inland Empire because of its proximity to major transportation hubs, large population, and relatively affordable land and labor costs.

- Population: 4,600,396
- Population growth (year over year): 0.61%
- Job growth (year over year): 0.62%
- Unemployment rate: 3.4%
- Median age: 34.8
- Per capita income: $28,263
- Median household income: $68,331
- Total industrial inventory: 695,026,880 SF
- Average asking rent: $11.40/SF per year, NNN
- Vacancy rate: 1.3%
- Absorption (past 12 months): 31,880,284 SF
- Under construction: 39,353,624 SF
- Investment sales trends: $1.1 billion in Q1 2022, median sales price $239/SF, market cap rate 4.2%
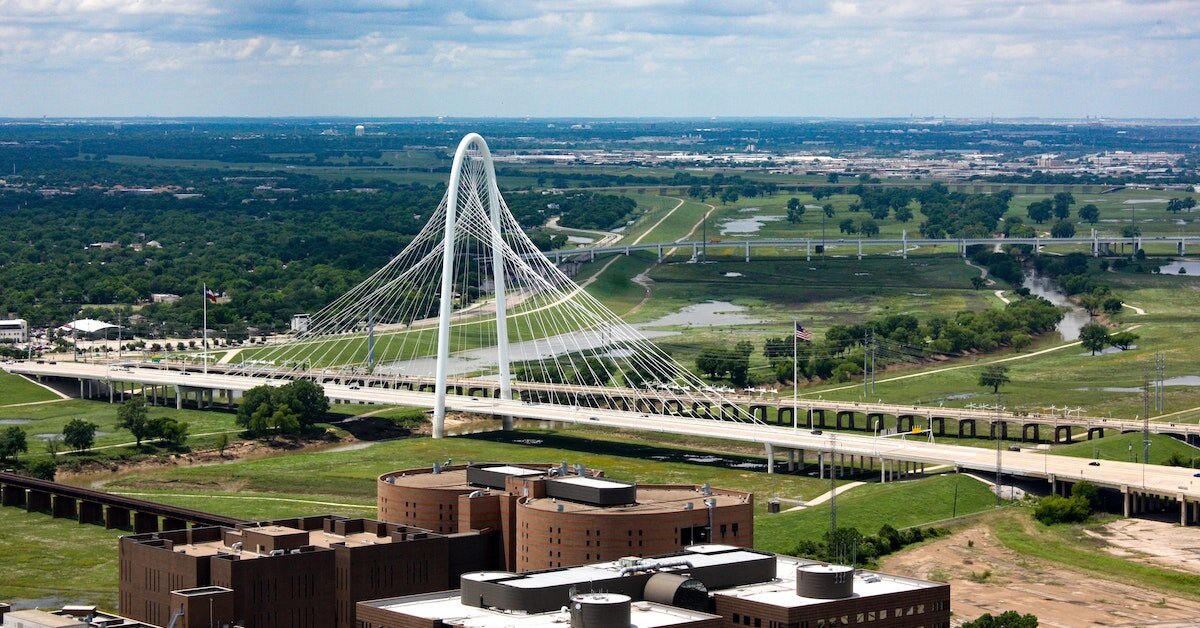
Dallas/Fort Worth
The Dallas/Fort Worth metropolitan area is one of the fastest-growing in the United States, with a population that topped 7 million in 2022. The region is known for its strong economy, driven by a diverse mix of industries, including technology, healthcare, finance, and manufacturing.
The industrial market in Dallas/Fort Worth is a powerhouse, with low vacancy rates and high demand from both tenants and investors. The region’s central location and proximity to major transportation hubs makes it an ideal place for businesses that rely on logistics and distribution. Additionally, the Dallas/Fort Worth Metroplex is home to many Fortune 500 companies, which helps drive demand for industrial space.
- Population: 7,451,858
- Population growth (year over year): 0.44%
- Job growth (year over year): 0.96%
- Unemployment rate: 3.3%
- Median age: 35.0
- Per capita income: $36,368
- Median household income: $72,882
- Total industrial inventory: 978,348,992 SF
- Average asking rent: $7.90/SF per year, NNN
- Vacancy rate: 5.8%
- Absorption (past 12 months): 38,936,500 SF
- Under construction: 69,706,696 SF
- Investment sales trends: $314 million in Q1 2022, median sales price $292/SF, market cap rate 5.7%
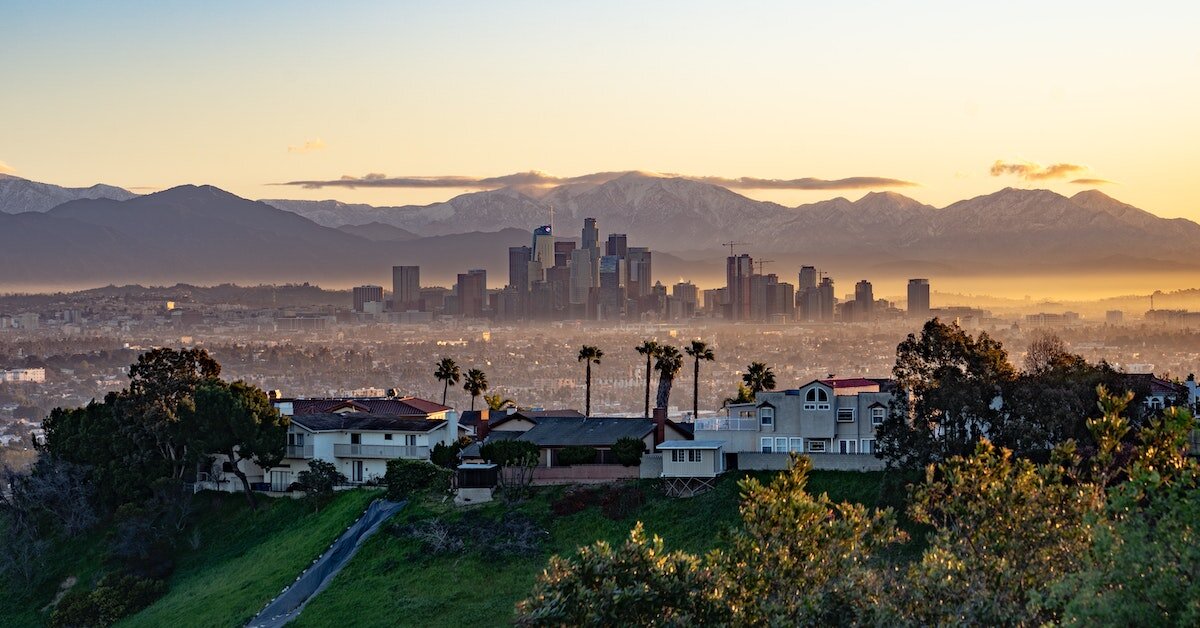
Los Angeles
Los Angeles is the largest city in California and the second-largest city in the United States. The Los Angeles metropolitan area is home to over 13 million people, making it one of the most populous regions in the country. The region’s economy hosts various industries, including entertainment, technology, healthcare, manufacturing, and transportation.
- Population: 13,211,027
- Population growth (year over year): -0.58%
- Job growth (year over year): 0.67%
- Unemployment rate: 5.2%
- Median age: 37.1
- Per capita income: $37,452
- Median household income: $76,399
- Total industrial inventory: 927,132,352 SF
- Average asking rent: $16.40/SF per year, NNN
- Vacancy rate: 1.6%
- Absorption (past 12 months): 13,935,685 SF
- Under construction: 5,449,115 SF
- Investment sales trends: $2.0 billion in Q1 2022, median sales price $291/SF, market cap rate 4.4%
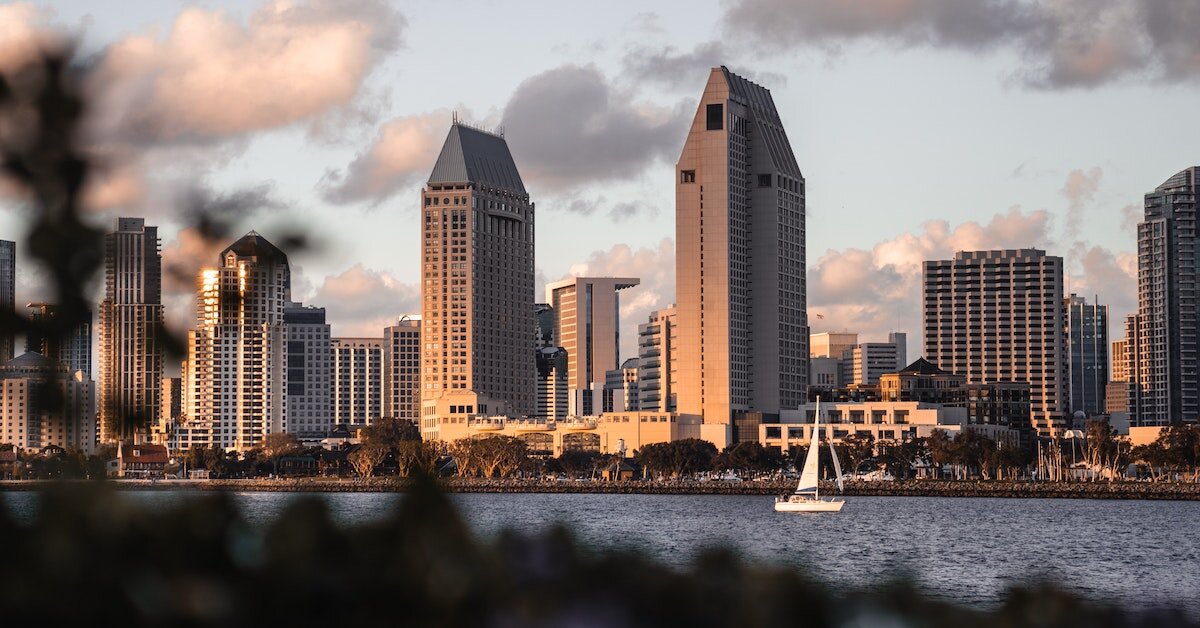
San Diego
San Diego is a major city in Southern California, about 120 miles south of Los Angeles. Tourism, defense, and biotech industries drive the region’s economy. With 3.3 million people to service and supply, this market is very attractive for industrial.
San Diego’s location and proximity to Mexico make it an ideal place for businesses that rely on international trade. Additionally, the city’s significant military presence helps to drive demand for industrial space. San Diego has a large industrial inventory for a city its size, but vacancy rates are low, and rents are high due to the strong demand from tenants.
According to PRO broker Brent Bohlken, SVP at Lee & Associates, “We are a supply-constrained market with almost no available land to build new inventory. Industrial vacancy in most San Diego submarkets is 2-3%.”
- Population: 3,323,970
- Population growth (year over year): -0.15%
- Job growth (year over year): 1.15%
- Unemployment rate: 2.7%
- Median age: 37.1
- Per capita income: $39,737
- Median household income: $82,426
- Total industrial inventory: 197,714,944 SF
- Average asking rent: $19.10/SF per year, NNN
- Vacancy rate: 2.9%
- Absorption (past 12 months): 8,630,802 SF
- Under construction: 2,957,924 SF
- Investment sales trends: $831 million in Q1 2022, median sales price $433/SF, market cap rate 5.1%
Bohlken also notes that the life science industry in San Diego is growing rapidly: “Property owners are converting industrial to life science– making an already supply-constrained market even tighter.”
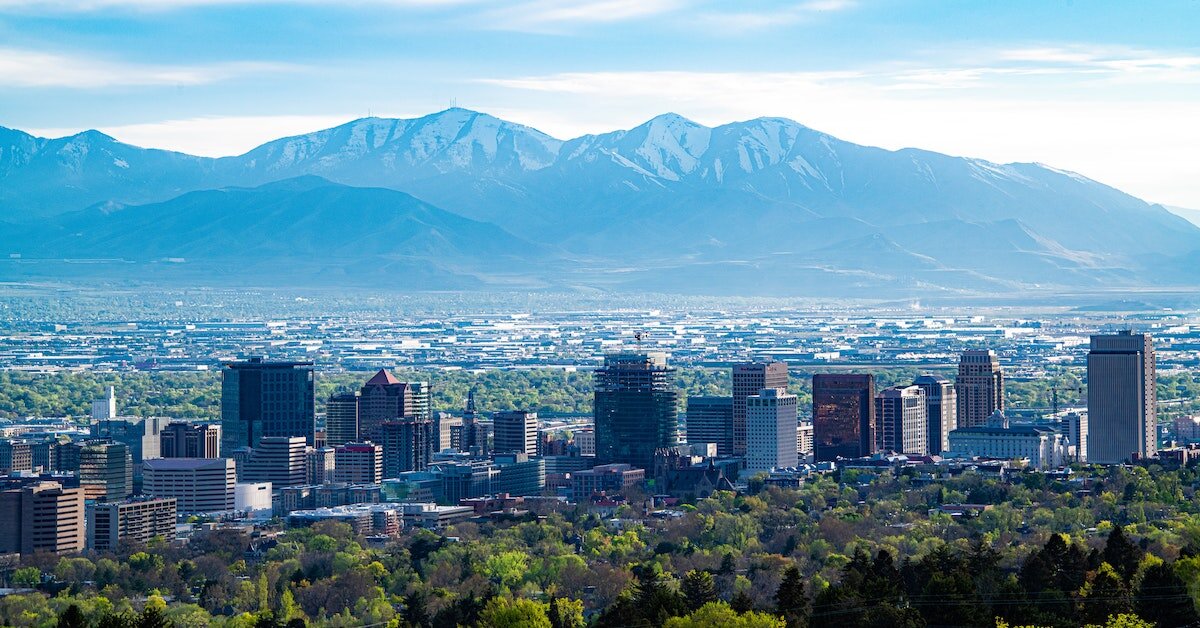
Salt Lake City
Salt Lake City is the capital of Utah and is part of the Salt Lake City metropolitan area. The city’s economy is driven by a diverse mix of industries, including technology, healthcare, finance, and manufacturing. Salt Lake City’s central location and proximity to major transportation hubs make it an ideal place for businesses that rely on logistics and distribution.
- Population: 1,215,955
- Population growth (year over year): 0.83%
- Job growth (year over year): 3.01%
- Unemployment rate: 2.2%
- Median age: 32.9
- Per capita income: $34,242
- Median household income: $77,102
- Total industrial inventory: 161,865,008 SF
- Average asking rent: $9.10/SF per year, NNN
- Vacancy rate: 3.1%
- Absorption (past 12 months): 6,403,434 SF
- Under construction: 11,133,060 SF
- Investment sales trends: $5 million in Q1 2022, median sales price $115/SF, market cap rate 6.7%
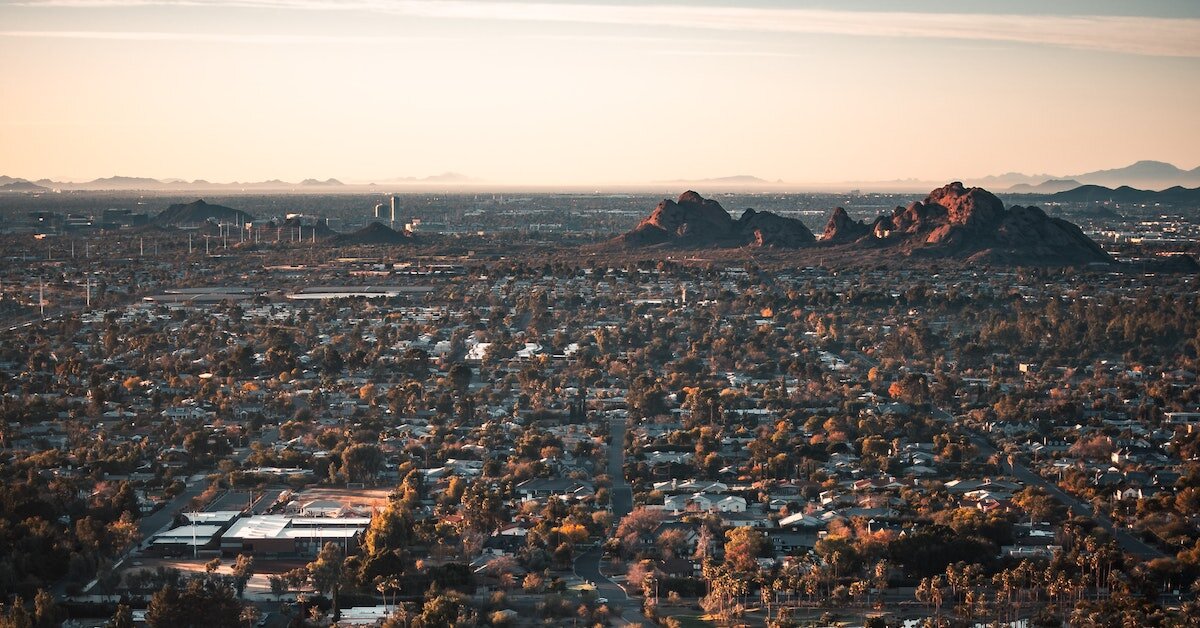
Phoenix
The Phoenix metropolitan area is home to nearly 5 million people and is the fifth largest city in the United States. The region’s economy is driven by various industries, including construction, healthcare, technology, and transportation.
Quite a few things make Phoenix attractive for this asset type: proximity to major markets in Southern California, a growing population, and a friendly business environment. “While prices have increased substantially over the last few years, we are still more affordable than Southern California markets,” reports PRO broker Max Schumacher at Rein & Grossoehme Commercial Real Estate.
Phoenix is an ideal place for businesses that rely on logistics and distribution. The Phoenix industrial market is characterized by strong demand and low vacancy rates. As a result, rents are high, and investment activity in the market is robust.
In terms of niche industrial assets, keep an eye out for Industrial Outside Storage (IOS). “Industrial Outside Storage sites are usually at least 3 acres and may or may not feature a building. Rents on these types of assets are up about 40% YoY, and they are getting harder and harder to find both from a leasing and sales front. In the last two years, there has been an emergence of institutional groups chasing these sites, and they have driven pricing through the roof,” says Schumacher.
- Population: 4,860,338
- Population growth (year over year): 1.86%
- Job growth (year over year): 2.83%
- Unemployment rate: 2.9%
- Median age: 36.9
- Per capita income: $34,378
- Median household income: $67,068
- Total industrial inventory: 377,472,928 SF
- Average asking rent: $10.30/SF per year, NNN
- Vacancy rate: 4.5%
- Absorption (past 12 months): 24,843,688 SF
- Under construction: 38,983,032 SF
- Investment sales trends: $943 million in Q1 2022, median sales price $156/SF, market cap rate 5.8%
Mr. Schumacher highlights Phoenix’s key players in a regional breakdown: “In the East Valley, you are seeing lots of growth in the manufacturing and aerospace industries. You also have many smaller local and regional companies in the east valley submarkets…generally service providers or contractors such as restoration companies or plumbing contractors. The West Valley is known for larger distribution centers, so you see lots of 3PLs, e-commerce companies, etc.”
Check out our recent podcast episode on Industrial properties in Phoenix, AZ.
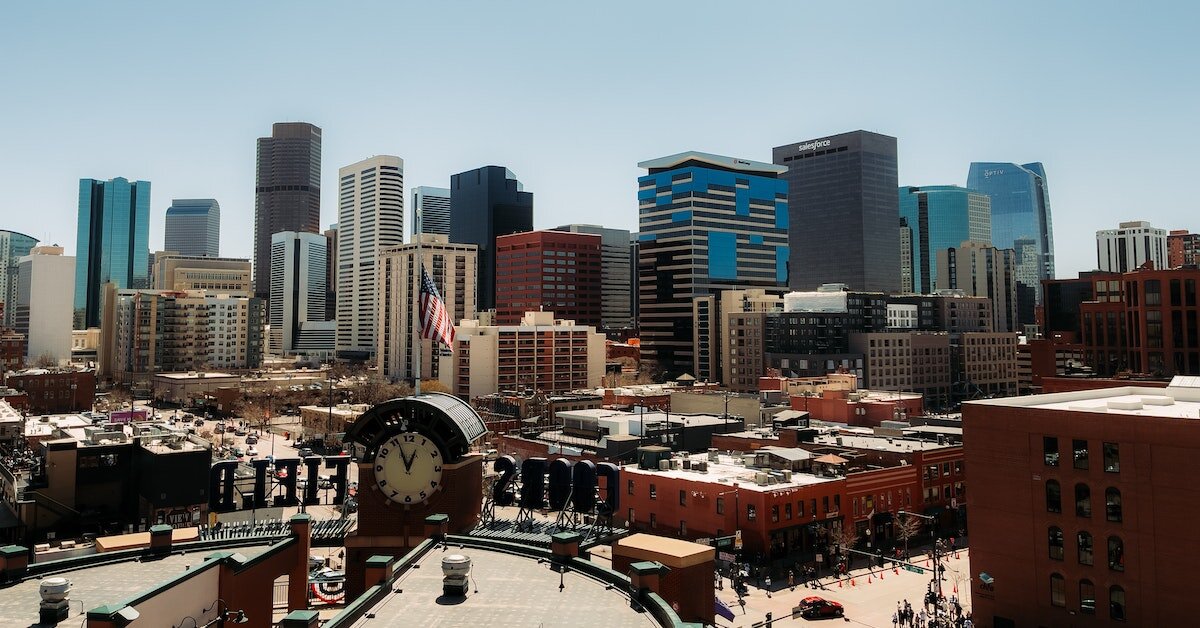
Denver
Investors looking to purchase industrial property in the Denver metropolitan area will find a strong market with plenty of opportunity. The Denver metro area has seen significant industrial growth in recent years, and that trend looks to continue. With a population of nearly 3 million people, Denver’s central location makes it a prime location for distribution centers and other businesses that need to be able to reach a large area.
- Population: 2,928,437
- Population growth (year over year): 1.19%
- Job growth (year over year): 1.0%
- Unemployment rate: 3.1%
- Median age: 36.7
- Per capita income: $43,427
- Median household income: $83,289
- Total industrial inventory: 248,578,320 SF
- Average asking rent: $11.10/SF per year, NNN
- Vacancy rate: 5.4%
- Absorption (past 12 months): 8,453,848 SF
- Under construction: 10,143,025 SF
- Investment sales trends: $475 million in Q1 2022, median sales price $161/SF, market cap rate 6.1%
Keep up with the latest industrial trends with Crexi Intelligence.