


Listed by ParaSell Inc, Hanley Investment Group
$3,248,000
Dutch Bros | Des Moines, IA
Details
Property Type Retail
Sub Type QSR/Fast Food
Square Footage 986
Net Rentable (SqFt) 986
Cap Rate 5.50%
NOI $178,653
Occupancy 100%
Tenancy Single
Brand/Tenant Starbucks, Chick-fil-A
Lease Type Absolute NNN
Remaining Term 15
Rent Bumps Yes
Lease Options Three 5-Year @ 10%
Year Built 2026
Acreage 1.280
Investment Type Net Lease
Tenant Credit Corporate Guarantee
Ground Lease No
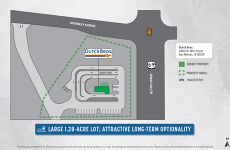
Huge 1.28-Acre Lot | Walmart Shadow-Anchored | Corporate 15-Yr Abs. NNN
Marketing description
CLICK HERE FOR FULL OFFERING MEMORANDUM: https://hanleyinvestmentgroup.com/listings/?id=a0EPg000008tw1x&track=rbYKnlNljdtIEyuu-zCKXCXfe
Investment highlights
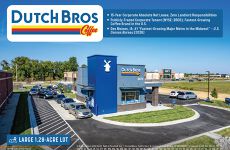
Dutch Bros Coffee | Des Moines, IA
Brand New 2026-Construction, Single-Tenant, Double-Drive-Thru
4800 SE 14th Street, Des Moines, IA 50320
Investment Highlights
15-Year Absolute NNN Corporate Lease | Zero Landlord Responsibilities
- 10% rental increases every 5 years during the initial term and each of the three 5-year options
Huge 1.28-Acre Lot*** | Attractive Long-Term Optionality for Incoming Ownership
Premier Real Estate Fundamentals
- Shadow-anchored by a top-performing Walmart Nationwide (Top 25%)
- Situated on a hard corner, signalized intersection along SE 14th Street, a major north-south retail corridor feeding into Downtown Des Moines
Strong Corporate Guarantee | Publicly-Traded Tenant (NYSE: BROS)
- Nation's fastest-growing coffee brand, with 1,100+ locations across 25 states
- Plans to reach 2,000+ shops by 2029
- Impressive average-unit volume exceeding $2.2M
- Same-store sales climbed 8.3%, marking the seventh consecutive quarter of traffic growth
- Reported a 28% increase in 2025 revenues, reaching $1.64 billion, with a market cap in excess of $8.68 billion
Des Moines: #1 Fastest-Growing Major Metro in the Midwest
- 758,000+ metro population
- 20% population growth from 2010 to 2021 (U.S. Census Bureau)
- #4 "Most Livable Metro in the U.S." out of 149 metros evaluated – RentCafe (2026)
- MSA GDP exceeded $62 billion in 2024, up $2 billion year-over-year – DSM USA Data Hub
Listing Contacts
Listed by ParaSell Inc, Hanley Investment Group
Valuation Calculator
Login or Sign up to see Valuation Metrics
Sign up for Crexi to see valuation metrics for this property
Loan Amount
$0.00
Annual Debt Service
$--
$--
Annual Cash Flow
$178,653.00
$14,887.75/mo
Valuation Metrics
0
DSCR
5.5%
Cap Rate
5.5%
ROI
Map
Zoning
PUD PlannedPlanned Unit Development
View municipality zoning documents Upgrade to see the zone description and what's allowed on this property
Upgrade to search and view land use codes
Last updated May 8, 2026 For deeper zoning details, reports are available at Zoneomics
Broker Selected Comps View More Comps
Property History
Tax History
Similar Properties
Additional Information
Name
License
Brokerage Phone
Is there information that looks off?