


The Main Avenue Portfolio
102-Unit Historic Adaptive Reuse Portfolio - Complete Architect Package - High Yield Pro-Forma
Marketing description
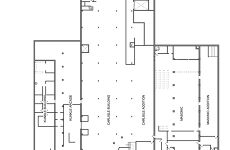
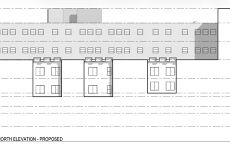
An unprecedented off-market opportunity to acquire a contiguous, dual-building downtown landmark portfolio totaling ±159,000 gross square feet. The properties have been master-planned by elite historic preservation architectural specialists into a high-density footprint consisting of 102 residential units, a turn-key first-floor anchor restaurant space, and an expansive public community center / historic auditorium venue.
By acquiring this entire block footprint, an institutional master developer commands immediate local market share dominance and unlocks exceptional economic incentives via Federal and State Historic Preservation Tax Credits (HTC) and regional development grants. This project is heavily de-risked with advanced architectural programming already completed, allowing an incoming group to skip months of design-phase delays and move straight toward construction financing and permitting.
Investment highlights
- Unrivaled Scalability: Finding nearly 160,000 SF of urban core density across a contiguous block is virtually impossible in this regional sub-market. This portfolio gives an incoming fund immediate, unshakeable market dominance.
- Advanced Architectural De-Risking: Substantial private capital has already been deployed to engineer highly advanced, space-optimized architectural layouts. This slashes holding costs by months, moving the incoming buyer straight to construction pricing.
- High-Yield Mixed-Use Dynamic: The inclusion of a 4,014 SF restaurant anchor and a 4,481 SF historic theater hall means this asset isn't just a place to sleep—it's an instantly recognizable regional lifestyle destination capable of driving massive ancillary revenue.
- Substantial Capital Subsidies: Because of the documented construction dates (1909–1926), both core assets are premier candidates for Federal and State Historic Preservation Tax Credits (HTC), potentially offsetting up to 40-45% of eligible rehabilitation expenditures.
Listing Contacts
Valuation Calculator
Valuation Metrics
Map
Zoning
Broker Selected Comps View More Comps
Property History
Tax History
Similar Properties
Is there information that looks off?